
Statistics For Business And Economics, University Of Connecticut
18th Edition
ISBN: 9781323751497
Author: Mcclave/benson/sincich
Publisher: Pearson Education
expand_more
expand_more
format_list_bulleted
Videos
Textbook Question
Chapter 15.2, Problem 15.10ACB
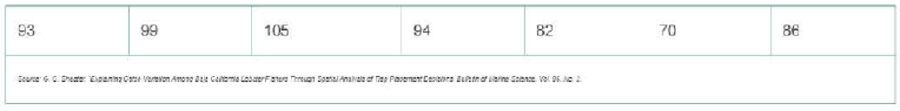
Lobster trap placement. Refer to the Bulletin of Marine Science (April 201 0) observational study of lobster trap placement by teams fishing for the red spiny lobster in Baja California Sur. Mexico, Exercise 7.54 (p. 393). Trap-spacing measurements (in meters) for a sample of seven teams of red spiny lobster fishermen are reproduced in the accompanying table. In Exercise 7.54, you tested whether the average of the trap-spacing measurements for the population of red spiny lobster fishermen fishing in Baja California Sur, Mexico, differs from 95 meters.
- a. There is concern that the trap-spacing data do not follow a
normal distribution . If so, how will this impact the test you conducted in Exercise 7.54? - b. Propose an alternative non parametric test to analyze the data.
- c. Compute the value of the test statistic for the nonparametric test.
- d. Find the p-value of the test.
- e. Use the value of a you selected in Exercise 7.54 and give the appropriate conclusion.
Expert Solution & Answer
Want to see the full answer?
Check out a sample textbook solution
Students have asked these similar questions
The article “Dynamics of Insulin Action in Hypertension: Assessment from Minimal ModelInterpretation of Intravenous Glucose Tolerance Test Data” (R. Burattini, M. Morettini, etal., Med Biol Eng Comput, 2011:831–841) compared levels of an insulin sensitivity index SIin patients with high blood pressure and patients with normal blood pressure. Ten patientswith high blood pressure had a mean value of 3.4 with a standard deviation of 0.6, and eightpatients with normal blood pressure had a mean value of 7.9 with a standard deviation of0.6. Units are 10−5 · min−1 · pmol−1. Find a 98% confidence interval for the difference inmean levels between those with high blood pressure and those with normal blood pressure.
A researcher conducted a repeated measures study comparing three treatment conditions. Refer to attached images and tale to answer a to d.
Mean
Std. Deviation
N
Treatment I
1.00
1.414
5
Treatment II
5.00
2.345
5
Treatment III
6.00
1.581
5
In APA format, report the F-ratio related to the treatment effect:
Is this treatment effect significant?
What is the partial η2 value for the treatment effect?
Is this a weak, moderate, or strong effect?
In a study examining the effect of alcohol on reaction
time, Liguori and Robinson (2001) found that even
moderate alcohol consumption significantly slowed
response time to an emergency situation in a driving
simulation. In a similar study, researchers measured
reaction time 30 minutes after participants consumed
one 6-ounce glass of wine. Again, they used a stan
dardized driving simulation task for which the regular
population averages μ = 400 msec. The distribution of
reaction times is approximately normal with σ = 40.
Assume that the researcher obtained a sample mean of
M = 422 for the n = 25 participants in the study.
a. Are the data sufficient to conclude that the alcohol
has a significant effect on reaction time? Use a
two-tailed test with α = .01.
b. Do the data provide evidence that the alcohol
significantly increased (slowed) reaction time? Use
a one-tailed test with α = .01.
c. Compute Cohen’s d to estimate the size of the
effect.
Chapter 15 Solutions
Statistics For Business And Economics, University Of Connecticut
Ch. 15.2 - Under what circumstances is the sign test...Ch. 15.2 - What is the probability that a randomly selected...Ch. 15.2 - Use Table I of Appendix D to calculate the...Ch. 15.2 - Consider the following sample of 10 measurements....Ch. 15.2 - Suppose you wish to conduct a test of the research...Ch. 15.2 - Accidents at construction sites. Refer to the...Ch. 15.2 - Salaries of experienced MBA graduates. According...Ch. 15.2 - Caffeine in Starbucks coffee. Researchers at the...Ch. 15.2 - Short-sale stock returns. The Securities and...Ch. 15.2 - Lobster trap placement. Refer to the Bulletin of...
Ch. 15.2 - Repair and replacement costs of water pipes. Refer...Ch. 15.2 - Performance of stock screeners. Refer to Exercise...Ch. 15.2 - Radon exposure in Egyptian tombs. Refer to the...Ch. 15.2 - Prob. 15.14ACICh. 15.3 - Prob. 15.15LMCh. 15.3 - Specify the test statistic and the rejection...Ch. 15.3 - Prob. 15.17LMCh. 15.3 - Prob. 15.18LMCh. 15.3 - Prob. 15.19ACBCh. 15.3 - Prob. 15.21ACBCh. 15.3 - Prob. 15.22ACBCh. 15.3 - The X-Factor in golf performance. Many golf...Ch. 15.3 - Prob. 15.24ACICh. 15.3 - Prob. 15.25ACICh. 15.3 - Prob. 15.26ACICh. 15.3 - Does rudeness really matter in the workplace?...Ch. 15.3 - Prob. 15.28ACICh. 15.4 - Prob. 15.29LMCh. 15.4 - Prob. 15.30LMCh. 15.4 - Prob. 15.31LMCh. 15.4 - Prob. 15.32LMCh. 15.4 - Twinned drill holes. Refer to the Exploration and...Ch. 15.4 - Prob. 15.34ACBCh. 15.4 - Prob. 15.35ACBCh. 15.4 - Prob. 15.36ACBCh. 15.4 - Prob. 15.37ACBCh. 15.4 - Prob. 15.38ACICh. 15.4 - Prob. 15.39ACICh. 15.4 - Prob. 15.40ACICh. 15.4 - Prob. 15.41ACICh. 15.4 - Prob. 15.42ACICh. 15.5 - Under what circumstances does the 2 distribution...Ch. 15.5 - Data were collected from three populations, A, B....Ch. 15.5 - Prob. 15.45LMCh. 15.5 - Prob. 15.46ACBCh. 15.5 - Prob. 15.47ACBCh. 15.5 - Prob. 15.48ACBCh. 15.5 - Prob. 15.49ACBCh. 15.5 - Prob. 15.50ACICh. 15.5 - Public defenders salaries. Random samples of seven...Ch. 15.5 - Prob. 15.52ACICh. 15.5 - Prob. 15.53ACICh. 15.6 - Prob. 15.54LMCh. 15.6 - Prob. 15.55LMCh. 15.6 - Prob. 15.56LMCh. 15.6 - Prob. 15.57ACBCh. 15.6 - Condit ions impeding farm production. A review of...Ch. 15.6 - Peer mentor training at a firm. Refer to the...Ch. 15.6 - Prob. 15.60ACBCh. 15.6 - Prob. 15.61ACICh. 15.6 - Prob. 15.62ACICh. 15.6 - Prob. 15.63ACICh. 15.6 - Prob. 15.64ACICh. 15.6 - Prob. 15.65ACICh. 15.7 - Prob. 15.66LMCh. 15.7 - Prob. 15.67LMCh. 15.7 - The following sample data were collected on...Ch. 15.7 - Compute Spearman s rank correlation coefficient...Ch. 15.7 - Charisma of top-level leaders. Refer to the...Ch. 15.7 - Prob. 15.71ACBCh. 15.7 - Prob. 15.72ACBCh. 15.7 - Prob. 15.73ACBCh. 15.7 - Prob. 15.74ACICh. 15.7 - Prob. 15.75ACICh. 15.7 - Prob. 15.76ACICh. 15.7 - Prob. 15.77ACICh. 15.7 - Sweetness of orange juice Refer to the orange...Ch. 15.7 - Americas most reputable companies. Forbes magazine...Ch. 15 - The data for three independent random samples are...Ch. 15 - Prob. 15.81LMCh. 15 - Two independent random samples produced the...Ch. 15 - Prob. 15.83LMCh. 15 - Prob. 15.84ACBCh. 15 - Prob. 15.85ACBCh. 15 - Office rental growth rates Real estate market...Ch. 15 - RIF plan to fire older employees. Reducing the...Ch. 15 - Prob. 15.88ACBCh. 15 - Wine-tasting experiment. Two expert wine tasters...Ch. 15 - Employee suggestion system. An employee suggestion...Ch. 15 - Prob. 15.91ACICh. 15 - Prob. 15.92ACICh. 15 - Prob. 15.93ACICh. 15 - Prob. 15.94ACICh. 15 - Cooling method for gas turbines. Refer to the...Ch. 15 - Flexible working hours program. A job-scheduling...Ch. 15 - Fluoride in drinking water. Many water treatment...Ch. 15 - Does fatigue lead to more defectives? A...Ch. 15 - Prob. 15.99ACICh. 15 - Prob. 15.100ACICh. 15 - Prob. 15.101ACICh. 15 - Groundwater contamination of wells. Methyl...
Knowledge Booster


Learn more about
Need a deep-dive on the concept behind this application? Look no further. Learn more about this topic, statistics and related others by exploring similar questions and additional content below.Similar questions
- In a bumper test, three test vehicles of each of three types of autos were crashed into a barrier at 5 mph, and the resulting damage was estimated. Crashes were from three angles: head-on, slanted, and rear-end. The results are shown below. Research questions: Is the mean repair cost affected by crash type and/or vehicle type? Are the observed effects (if any) large enough to be of practical importance (as opposed to statistical significance)? 5 mph Collision Damage ($) Crash Type Goliath Varmint Weasel Head-On 750 1,740 2,250 1,400 1,660 1,690 800 1,630 1,740 Slant 1,450 1,800 2,080 1,790 1,750 1,500 1,270 1,600 2,410 Rear-end 720 870 1,660 1,240 1,580 1,670 940 1,290 1,210 Click here for the Excel Data File (a-1) Choose the correct row-effect hypotheses. a. H0: A1 ≠ A2 ≠ A3 ≠ 0 ⇐⇐ Angle means differ H1: All the Aj are equal to zero ⇐⇐ Angle means are the same b. H0: A1 = A2 = A3 = 0 ⇐⇐ Angle means are the same H1:…arrow_forwardIn a bumper test, three test vehicles of each of three types of autos were crashed into a barrier at 5 mph, and the resulting damage was estimated. Crashes were from three angles: head-on, slanted, and rear-end. The results are shown below. Research questions: Is the mean repair cost affected by crash type and/or vehicle type? Are the observed effects (if any) large enough to be of practical importance (as opposed to statistical significance)? 5 mph Collision Damage ($) Crash Type Goliath Varmint Weasel Head-On 700 1,700 2,280 1,400 1,650 1,670 850 1,630 1,740 Slant 1,430 1,850 2,000 1,740 1,700 1,510 1,240 1,650 2,480 Rear-end 700 860 1,650 1,250 1,550 1,650 970 1,250 1,240 (d) Perform Tukey multiple comparison tests. (Input the mean values within the input boxes of the first row and input boxes of the first column. Round your t-values and critical values to 2 decimal places and other answers to 3 decimal places.) Post hoc analysis…arrow_forward
Recommended textbooks for you
 Glencoe Algebra 1, Student Edition, 9780079039897...AlgebraISBN:9780079039897Author:CarterPublisher:McGraw Hill
Glencoe Algebra 1, Student Edition, 9780079039897...
Algebra
ISBN:9780079039897
Author:Carter
Publisher:McGraw Hill
Introduction to experimental design and analysis of variance (ANOVA); Author: Dr. Bharatendra Rai;https://www.youtube.com/watch?v=vSFo1MwLoxU;License: Standard YouTube License, CC-BY