
Concept explainers
Videos
a.
Check whetherthe river community was releasing semi treated sewage into the river.
a.
Answer to Problem 15.8E
There is no sufficient evidence to indicate that the river community was releasing semi treated sewage into the river.
Explanation of Solution
Given:
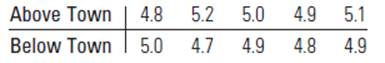
The given data set is
Calculation:
The sample size
The null hypothesis tells that there is no difference in the populations. The alternative hypothesis is opposite of null hypothesis.
Find the rank of every data.
The rank of smallest value is one. The rank of second smallest value is two and so on.
The multiple data have the same value. The rank is the average of the corresponding ranks.
| Sample 1 | Rank | Sample 2 | Rank |
Find a distribution one is shifted either to the left or to the right of distribution two.
The test is left tailed
The test is right tailed
The test is two tailed
Find
The given test is right tailed. Find the value of
The critical value for the Wilcoxon rank sum test
Row
Column
From the table of the Wilcoxon rank sum test
Hence the rejection region that contains all values
If the value of the test statistic is in the rejection region, then reject the null hypothesis.
The test statistic is notin the rejection region.
Hence there is no sufficient evidence to indicate thatthe river community was releasing semi treated sewage into the river.
b.
Check whether the river community was releasing semi treated sewage into the river.
b.
Answer to Problem 15.8E
It is the same conclusion as part ‘a’.
Explanation of Solution
Given:
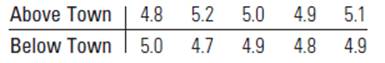
The given data set is
Calculation:
The sample size
The null hypothesis tells that there is no difference in the populations. The alternative hypothesis is opposite of null hypothesis.
Find the rank of every data.
The rank of smallest value is one. The rank of second smallest value is two and so on.
The multiple data have the same value. The rank is the average of the corresponding ranks.
| Sample 1 | Rank | Sample 2 | Rank |
Find mean of both the sample.
Find the sample standard deviation.
There is no one deviation is more than three times the other deviation.
Use pooled t-test.
The means of above town is higher.
Find the pooled standard deviation.
Find the test statistic.
The p-value is the probability of obtaining the value of the test static.
Use student t distribution table and find the value of p.
Row
If the p-value is less than or equal to the significance level, then the null hypothesis is rejected.
There is no sufficient evidence to indicate that the river community was releasing semi treated sewage into the river.
Hence it is the same conclusion as part ‘a’.
Want to see more full solutions like this?
Chapter 15 Solutions
Introduction to Probability and Statistics


 Functions and Change: A Modeling Approach to Coll...AlgebraISBN:9781337111348Author:Bruce Crauder, Benny Evans, Alan NoellPublisher:Cengage Learning