
Videos
a.
To find:whether the sufficient evidence exist to indicate a difference in the mean response time for two stimuli.
a.
Answer to Problem 15.55SE
No.
Explanation of Solution
Given:
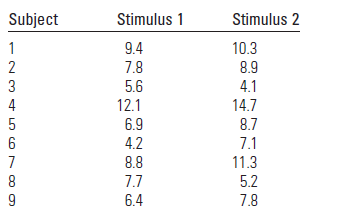
An experiment was conducted to compare the response time for two stimuli.
To remove natural person to person variability in the response, both stimuli were presented to each of the nine subjects.
The given below table is response times (in second)
Calculation:
The null hypothesis states that there is no difference in the populations. The alternatives hypothesis states the opposite of the null hypothesis.
Determine the difference in the data in the data values of each pair and determine the sign of the difference. Difference of 0 are ignored.
| First sample | Second sample | Difference | Sign |
| 9.4 | 10.3 | ||
| 7.8 | 8.9 | ||
| 5.6 | 4.1 | ||
| 12.1 | 14.7 | ||
| 6.9 | 8.7 | ||
| 4.2 | 7.1 | ||
| 8.8 | 11.3 | ||
| 7.7 | 5.2 | ||
| 6.4 | 7.8 |
The observe value of the test statistics is then the number of positives signs.
The
If the
There is not sufficient evidence to reject the claim that two schools are the same in academic effectiveness.
b.
To test: the hypothesis of no difference in the mean response time using student’s
b.
Answer to Problem 15.55SE
There is not sufficient evidence to support the claim that there is a difference in the mean response time for the two stimuli.
Explanation of Solution
Given:
An experiment was conducted to compare the response time for two stimuli.
To remove natural person to person variability in the response, both stimuli were presented to each of the nine subjects.
Calculation:
First to find the difference between each pair of data values
| First sample | Second sample | Difference |
| 9.4 | 10.3 | |
| 7.8 | 8.9 | |
| 5.6 | 4.1 | |
| 12.1 | 14.7 | |
| 6.9 | 8.7 | |
| 4.2 | 7.1 | |
| 8.8 | 11.3 | |
| 7.7 | 5.2 | |
| 6.4 | 7.8 |
Now, find the sample mean of the differences. The mean is the sum of all values divided by the number of values.
The variance is the sum of squared deviations from the mean divided by
Therefore, the sample standard deviation of the differences:
the claim is either the null hypothesis or the alternative hypothesis. The null hypothesis needs to contain an equality. If the null hypothesis the claim, then the alternative hypothesis states that opposite of the null hypothesis.
now, to find the value of the test statistic:
The
If the
There is not sufficient evidence to support the claim that there is a difference in the mean response time for the two stimuli.
Want to see more full solutions like this?
Chapter 15 Solutions
Introduction to Probability and Statistics


 MATLAB: An Introduction with ApplicationsStatisticsISBN:9781119256830Author:Amos GilatPublisher:John Wiley & Sons Inc
 Probability and Statistics for Engineering and th...StatisticsISBN:9781305251809Author:Jay L. DevorePublisher:Cengage Learning
 Statistics for The Behavioral Sciences (MindTap C...StatisticsISBN:9781305504912Author:Frederick J Gravetter, Larry B. WallnauPublisher:Cengage Learning
 Elementary Statistics: Picturing the World (7th E...StatisticsISBN:9780134683416Author:Ron Larson, Betsy FarberPublisher:PEARSON
 The Basic Practice of StatisticsStatisticsISBN:9781319042578Author:David S. Moore, William I. Notz, Michael A. FlignerPublisher:W. H. Freeman
 Introduction to the Practice of StatisticsStatisticsISBN:9781319013387Author:David S. Moore, George P. McCabe, Bruce A. CraigPublisher:W. H. Freeman