
Videos
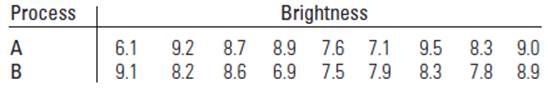
To find:the data present sufficient efficient to indicate a difference in brightness measurements for two process. Use both parametric and non-parametric test and compare the results
Answer to Problem 15.59SE
Non-parametric:There is sufficient evidence to support the claim that there is a difference in the brightness measurements for the two process.
Parametric: There is not sufficient evidence to support the claim that there is a difference in the brightness measurements for the two process.
Explanation of Solution
Given:
The coded values for measures of brightness in paper, prepared by two different process, are given in the table.
Calculation:
The null hypothesis states that there is no difference in the populations. The alternatives hypothesis states the opposite of the null hypothesis.
Determine the difference in the data in the data values of each pair and determine the sign of the difference. The smallest value receives the rank 1, the second smallest value receives the rank 2, the third smallest value receives the rank 3 and so on.
If the multiple data value has the same, then their rank is the average of the corresponding rank.
Now, to determine the difference in the ranks.
| First sample | Rank | Second sample | Rank |
| 6.1 | 1 | 6.9 | 2 |
| 7.1 | 3 | 7.5 | 4 |
| 7.6 | 5 | 7.8 | 6 |
| 8.3 | 9.5 | 7.9 | 7 |
| 8.7 | 12 | 8.2 | 8 |
| 8.9 | 13.5 | 8.3 | 9.5 |
| 9 | 15 | 8.6 | 11 |
| 9.2 | 17 | 8.9 | 13.5 |
| 9.5 | 18 | 9.1 | 16 |
When the test is left-tailed,
Next, it is determining the value of
The value of the test statistics is equal to min
The critical value of the Wilcoxon signed is given in the row
The rejection region contains all values smaller than or equal to
If the value of the test statistics is in the rejection region, then it rejects the null hypothesis
There issufficient evidence to support the claim that there is a difference in the brightness measurements for the two process.
Descriptive measures:
The mean is the sum of all values divided by the number of values:
Now, let us determine the squares of the difference of the rank
The sample variance is the sum of the squared deviation from the mean divided by
It is noted that neither of the variance is more than the other variance (as the same is true for the sample standard deviations) thus it is then appropriate to use the pooled test.
Parametric test (pooled
Given claim: The means differ
The claim is either null hypothesis or the alternatives hypothesis. The null hypothesis or the alternatives hypothesis states that these are opposite to each other. The null hypothesis needs to contain an equality.
Now, let us determine the pooled standard deviation:
Determine the test statistic:
The
If the
There is not sufficient evidence to support the claim that there is a difference in the brightness measurements for the two process.
Hence, it is concluded that both Parametric and Non-parametric:
Non-parametric: There is sufficient evidence to support the claim that there is a difference in the brightness measurements for the two process.
Parametric: There is not sufficient evidence to support the claim that there is a difference in the brightness measurements for the two process.
Want to see more full solutions like this?
Chapter 15 Solutions
Introduction to Probability and Statistics


- A dietitian wishes to see if a person’s cholesterol level will change if the diet is supplemented by a certain mineral. Six respondents were pretested and then took the mineral supplement for a six-week period. Can it be concluded that the cholesterol level has been changed at ? = 0.10Assume that the data is approximately normally distributed. Cholesterol level is measured in milligrams per deciliter. Show the 5 steps hypothesis testingarrow_forwardSelf-Reported Weight. The article “Accuracy of Self- Reported Height and Weight in a Community-Based Sample of Older African Americans and Whites” (Journal of Gerontology Series A: Biological Sciences and Medical Sciences, Vol. 65A, No. 10, pp. 1123–1129) by G. Fillenbaum et al. explores the relationship between measured and self-reported height and weight. The authors sampled African American and White women and men older than 70 years of age. A hypothesis test is to be performed to decide whether, on average, self-reported weight is less than measured weight for the aforementioned age group. a. identify the variable. b. identify the two populations. c. identify the pairs. d. identify the paired-difference variable. e. determine the null and alternative hypotheses. f. classify the hypothesis test as two tailed, left tailed, or right tailed.arrow_forwardA hypothesis test was being done and the hypothesis set up was Ho: p=.35 vs Ha: p<.35 The Z test statistic came out toz=−2.05z=-2.05 ALSOillustrate the region your are finding on a normal curve on your paper.arrow_forward
- LEDs and CFLs. Light-emitting diodes (LEDs) and compact fluorescent lights (CFLs) are lightbulbs that are supposed to last up to fifty times longer than old fashioned incandescent lightbulbs and also use less energy. Consumer Reports sampled eighteen different 60-watt LED and CFL lightbulbs. The following table lists their brightness, in lumens. Use the technology of your choice to decide whether applying the z-interval procedure to these data is reasonable. Explain youranswer. 900 690 910 745 765 820 700 360 925 805 850 730 6865 680 750 735 865arrow_forwardDetermine the kurtosis if the data given is a sample. Use 4 decimal placesarrow_forwardAssociation between PSA and prostate cancer PSA test result Prostate cancer Frequency + + 92 + − 27 − + 46 − − 72 (a) What are the sensitivity and specificity of the test? (b) What are the PV+ and PV − of the test?�arrow_forward
- A researcher was interested in whether head worn displays were better than tablet displays for assisting rst responders with their tasks. He had 17 paramedics use either a head worn display (n = 9) or a tablet display (n = 8) during a simulated medical emergency. Each paramedic’s subjective workload score was measured out of 20 (where 20 indicated the highest workload). The data did not conform to the assumptions of a parametric test. a. What is the rank sum for the Head worn display group? a. 80 b. 73 c. 71 d. 82 b. What is the WS? a. 71 b. 80 c. 73 d. 82 c. What critical value of WS do you compare your obtained value to? a. 53 b. 54 c. 49 d. 51arrow_forwardIn a chi-square test, the larger the difference between expected and observed frequencies, the more likely you are to: Choose to use a t ratio or some other parametric test Reject the null hypothesis Retain the null hypothesis Use the median testarrow_forwardNonparametric Statistics Wilcoxon-Mann-Whitney Testarrow_forward
- You design a study to test the impact of power study programsstatistics exam results. You choose 21 students randomly from a statistics class to participate in the study. You randomly assign each student to one of the power groups. Students are later tested with a statistics exam with the material covered in the power study programs. You plan to use an ANOVA to test the impact of each of the power study programs with exam results. Use an alpha level of .05. Report your computed F-ratio, critical region, and your conclusion to accept or reject the null hypothesis. Power Study#1 Power Study#2 Power Study#3 85 85 92 86 89 87 82 82 80 75 75 89 66 88 96 78 76 83 87 82 92arrow_forwardHow do you interpret this with a significance level of 0.05:Hartley's maximum F-ratio test of homogeneity of variances data: list(group1, group2, group3)F Max = 1.7, df = 7, k = 3, p-value = 0.7768 Do you go by the p-value? Since the p-value is greater than the level than the 0.05 significance level do you fail the reject the hypothesis? Or do you compare it to the critical value table? I am so confused!arrow_forwardYou wish to conduct a hypothesis test to determine if a bivariate data set has a significant correlation among the two variables. That is, you wish to test the claim that there is a correlation (Ha:ρ≠0Ha:ρ≠0). You have a data set with 25 subjects, in which two variables were collected for each subject. You will conduct the test at a significance level of α=0.05α=0.05.Find the critical value for this test.rc.v. = ±±Report answers accurate to three decimal places.arrow_forward
 MATLAB: An Introduction with ApplicationsStatisticsISBN:9781119256830Author:Amos GilatPublisher:John Wiley & Sons Inc
 Probability and Statistics for Engineering and th...StatisticsISBN:9781305251809Author:Jay L. DevorePublisher:Cengage Learning
 Statistics for The Behavioral Sciences (MindTap C...StatisticsISBN:9781305504912Author:Frederick J Gravetter, Larry B. WallnauPublisher:Cengage Learning
 Elementary Statistics: Picturing the World (7th E...StatisticsISBN:9780134683416Author:Ron Larson, Betsy FarberPublisher:PEARSON
 The Basic Practice of StatisticsStatisticsISBN:9781319042578Author:David S. Moore, William I. Notz, Michael A. FlignerPublisher:W. H. Freeman
 Introduction to the Practice of StatisticsStatisticsISBN:9781319013387Author:David S. Moore, George P. McCabe, Bruce A. CraigPublisher:W. H. Freeman