
Videos
With the use of biofuels increasing, investigators are looking for ways in which the wood ash that is a byproduct of biomass combustion can be used.
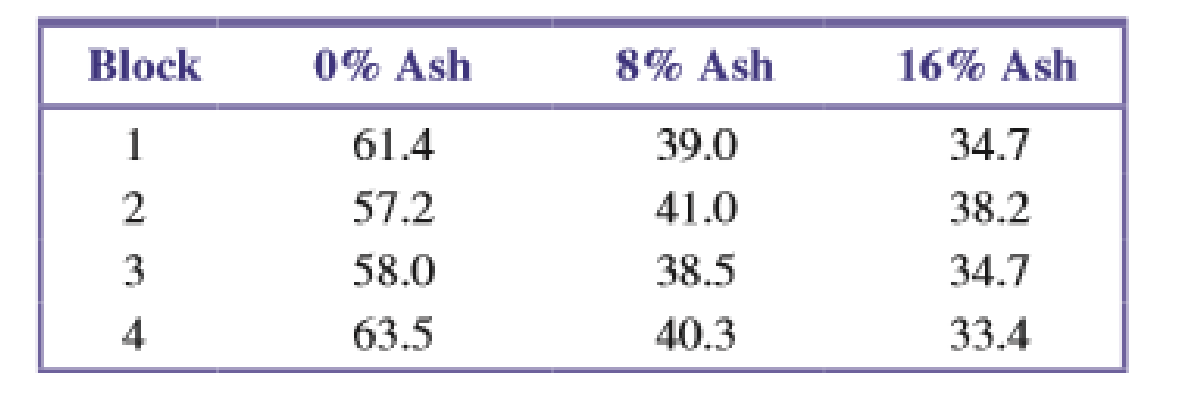
An experiment described in the paper “Wood Ash Admixture to Organic Wastes Improves Compost and Its Performance” (Agriculture, Ecosystems & Environment [2008]: 43–49) looked at the effect of using wood ash in compost. Composts with 0%, 8%, and 16% ash were applied to plots in an experimental field. The plots were grouped into four blocks to create blocks that consisted of plots with similar soil characteristics. Treatments (the three composts) were assigned at random to the plots within each block. At the end of the composting period, the concentration of lead (mg/kg) was measured.
Use the accompanying data (consistent with summary quantities given in the paper) to determine if there is evidence that the

Trending nowThis is a popular solution!

Chapter 15 Solutions
Introduction to Statistics and Data Analysis


- QUESTION 7 Problem 11.57ea: Provide a point estimate for the SE standard error of the regression. Use 3 decimals in your answer Hint: L-23: p 15 (Ex. 11.3dd)arrow_forwardA deficiency of the trace element selenium in the diet can negatively impact growth, immunity, muscle and neuromuscular function, and fertility. The introduction of selenium supplements to dairy cows is justified when pastures have low selenium levels. Authors of a research paper supplied the following data on milk selenium concentration (mg/L) for a sample of cows given a selenium supplement (the treatment group) and a control sample given no supplement, both initially and after a 9-day period. Initial Measurement Treatment Control 11.4 9.1 9.6 8.7 10.1 9.7 8.5 10.8 10.2 10.9 10.6 10.6 11.9 10.1 9.9 12.3 10.7 8.8 10.2 10.4 10.3 10.9 11.4 10.4 9.3 11.6 10.6 10.9 10.9 8.3 After 9 Days Treatment Control 138.3 9.2 104 8.9 96.4 8.9 89 10.1 88 9.6 103.8 8.6 147.3 10.4 97.1 12.4 172.6 9.2 146.3 9.5 99 8.4 122.3 8.8 103 12.5 117.8 9.1 121.5 93 (a) Use the given data for the treatment group to determine if…arrow_forwardA deficiency of the trace element selenium in the diet can negatively impact growth, immunity, muscle and neuromuscular function, and fertility. The introduction of selenium supplements to dairy cows is justified when pastures have low selenium levels. Authors of a research paper supplied the following data on milk selenium concentration (mg/L) for a sample of cows given a selenium supplement (the treatment group) and a control sample given no supplement, both initially and after a 9-day period. Initial Measurement Treatment Control 11.2 9.1 9.6 8.7 10.1 9.7 8.5 10.8 10.3 10.9 10.6 10.6 11.7 10.1 9.7 12.3 10.8 8.8 10.3 10.4 10.4 10.9 11.2 10.4 9.4 11.6 10.6 10.9 10.7 8.4 After 9 Days Treatment Control 138.3 9.3 104 8.7 96.4 8.7 89 10.1 88 9.6 103.8 8.6 147.3 10.2 97.1 12.2 172.6 9.3 146.3 9.5 99 8.2 122.3 8.9 103 12.5 117.8 9.1 121.5 93 (a) Use the given data for the treatment group to determine if there…arrow_forward
- Inorganic phosphorous is a naturally occurring element in all plants and animals, with concentrations increasing progressively up the food chain (fruit < vegetables < cereals < nuts < corpse). Geochemical surveys take soil samples to determine phosphorous content (in ppm, parts per million). A high phosphorous content may or may not indicate an ancient burial site, food storage site, or even a garbage dump. Independent random samples from two regions gave the following phosphorous measurements (in ppm). Assume the distribution of phosphorous is mound-shaped and symmetric for these two regions Region I: x1; n1 = 15 855 1550 1230 875 1080 2330 1850 1860 2340 1080 910 1130 1450 1260 1010 Region II: x2; n2 = 14 540 810 790 1230 1770 960 1650 860 890 640 1180 1160 1050 1020 (a) Use a calculator with mean and standard deviation keys to verify that x1, s1, x2, and s2. (Round your answers to one decimal place.) x1 = ppm s1 = ppm x2 = ppm s2 = ppm (b)…arrow_forwardA deficiency of the trace element selenium in the diet can negatively impact growth, immunity, muscle and neuromuscular function, and fertility. The introduction of selenium supplements to dairy cows is justified when pastures have low selenium levels. Authors of a research paper supplied the following data on milk selenium concentration (mg/L) for a sample of cows given a selenium supplement (the treatment group) and a control sample given no supplement, both initially and after a 9-day period. Initial Measurement Treatment Control 11.3 9.1 9.7 8.7 10.1 9.7 8.5 10.8 10.4 10.9 10.7 10.6 11.8 10.1 9.8 12.3 10.6 8.8 10.4 10.4 10.2 10.9 11.3 10.4 9.2 11.6 10.7 10.9 10.8 8.2 After 9 Days Treatment Control 138.3 9.4 104 8.8 96.4 8.8 89 10.1 88 9.7 103.8 8.7 147.3 10.3 97.1 12.3 172.6 9.4 146.3 9.5 99 8.3 122.3 8.9 103 12.5 117.8 9.1 121.5 93 (a) Use the given data for the treatment group to determine if…arrow_forwardInorganic phosphorous is a naturally occurring element in all plants and animals, with concentrations increasing progressively up the food chain (fruit < vegetables < cereals < nuts < corpse). Geochemical surveys take soil samples to determine phosphorous content (in ppm, parts per million). A high phosphorous content may or may not indicate an ancient burial site, food storage site, or even a garbage dump. Independent random samples from two regions gave the following phosphorous measurements (in ppm). Assume the distribution of phosphorous is mound-shaped and symmetric for these two regions Region I: x1; n1 = 15 855 1550 1230 875 1080 2330 1850 1860 2340 1080 910 1130 1450 1260 1010 Region II: x2; n2 = 14 540 810 790 1230 1770 960 1650 860 890 640 1180 1160 1050 1020 (a) Use a calculator with mean and standard deviation keys to verify that x1, s1, x2, and s2. (Round your answers to one decimal place.) x1 = ppm s1 = ppm x2 = ppm s2 = ppm…arrow_forward
- Inorganic phosphorous is a naturally occurring element in all plants and animals, with concentrations increasing progressively up the food chain (fruit < vegetables < cereals < nuts < corpse). Geochemical surveys take soil samples to determine phosphorous content (in ppm, parts per million). A high phosphorous content may or may not indicate an ancient burial site, food storage site, or even a garbage dump. Independent random samples from two regions gave the following phosphorous measurements (in ppm). Assume the distribution of phosphorous is mound-shaped and symmetric for these two regions. Region I: x,; n, = 15 857 1,553 1,230 875 1,080 2,330 1,850 1,860 2,340 1,080 910 1,130 1,450 1,260 1,010 Region II: x2; n2 = 14 538 810 790 1,230 1,770 960 1,650 860 890 640 1,180 1,160 1,050 1,020 n USE SALT (a) Use a calculator with mean and standard deviation keys to verify that x,, s,, X2, and s,. (Round your answers to four decimal places.) X, = ppm S, = ppm X2 ppm S2 ppm %3D (b) Let u, be…arrow_forwardInorganic phosphorous is a naturally occurring element in all plants and animals, with concentrations increasing progressively up the food chain (fruit < vegetables < cereals < nuts < corpse). Geochemical surveys take soil samples to determine phosphorous content (in ppm, parts per million). A high phosphorous content may or may not indicate an ancient burial site, food storage site, or even a garbage dump. Independent random samples from two regions gave the following phosphorous measurements (in ppm). Assume the distribution of phosphorous is mound-shaped and symmetric for these two regions. Region 1: x1;n1=15 857 1,551 1,230 875 1,080 2,330 1,850 1,860 2,340 1,080 910 1,130 1,450 1,260 1,010 region 11: x2;n2-14 538 812 790 1,230 1,770 960 1,650 860 890 640 1,180 1,160 1,050 1,020 (a)Use a calculator with mean and standard deviation keys to verify that x1, s1, x2, and s2. (Round your answers to four decimal places.) x1= ppm s1= ppm x2= ppm s2= ppm…arrow_forwardInorganic phosphorous is a naturally occurring element in all plants and animals, with concentrations increasing progressively up the food chain (fruit < vegetables < cereals < nuts < corpse). Geochemical surveys take soil samples to determine phosphorous content (in ppm, parts per million). A high phosphorous content may or may not indicate an ancient burial site, food storage site, or even a garbage dump. Independent random samples from two regions gave the following phosphorous measurements (in ppm). Assume the distribution of phosphorous is mound-shaped and symmetric for these two regions. Region I: x,; n, = 15 875 1,080 2,330 1,850 1,860 853 1,551 1,230 2,340 1,080 910 1,130 1,450 1,260 1,010 Region II: x,; n, = 14 540 808 790 1,230 1,770 960 1,650 860 890 640 1,180 1,160 1,050 | 1,020 In USE SALT (a) Use a calculator with mean and standard deviation keys to verify that x,, S,, x2, and s,. (Round your answers to four decimal places.) X1 ppm S. = ppm X2 ppm 52 ppm (b) Let u, be the…arrow_forward
- Inorganic phosphorous is a naturally occurring element in all plants and animals, with concentrations increasing progressively up the food chain (fruit < vegetables < cereals < nuts < corpse). Geochemical surveys take soil samples to determine phosphorous content (in ppm, parts per million). A high phosphorous content may or may not indicate an ancient burial site, food storage site, or even a garbage dump. Independent random samples from two regions gave the following phosphorous measurements (in ppm). Assume the distribution of phosphorous is mound-shaped and symmetric for these two regions. REGION I:X1;N1=15 857 1,551 1,230 875 1,080 2,330 1,850 1,860 2,340 1,080 910 1,130 1,450 1,260 1,010 REGION II:X2;N2=14 538 812 790 1,230 1,770 960 1,650 860 890 640 1,180 1,160 1,050 1,020 (a) Use a calculator with mean and standard deviation keys to verify that x1, s1, x2, and s2. (Round your answers to four decimal places.) x1= ppm s1= ppm x2= ppm s2= ppm…arrow_forwardInorganic phosphorous is a naturally occurring element in all plants and animals, with concentrations increasing progressively up the food chain (fruit < vegetables < cereals < nuts < corpse). Geochemical surveys take soil samples to determine phosphorous content (in ppm, parts per million). A high phosphorous content may or may not indicate an ancient burial site, food storage site, or even a garbage dump. Independent random samples from two regions gave the following phosphorous measurements (in ppm). Assume the distribution of phosphorous is mound-shaped and symmetric for these two regions Region I: x1; n1 = 15 855 1550 1230 875 1080 2330 1850 1860 2340 1080 910 1130 1450 1260 1010 Region II: x2; n2 = 14 540 810 790 1230 1770 960 1650 860 890 640 1180 1160 1050 1020 (a) Use a calculator with mean and standard deviation keys to verify that x1, S1, X2, and s2. (Round your answers to one decimal place.) X1 ppm S1 = ppm X2 = ppm S2 = ppm (b) Let µ1 be the population mean for x1 and let…arrow_forwardBody Fat. In the paper “Total Body Composition by Dual- Photon (153 Gd) Absorptiometry” (American Journal of Clinical Nutrition, Vol. 40, pp. 834–839), R. Mazess et al. studied methods for quantifying body composition. Eighteen randomly selected adults were measured for percentage of body fat, using dual-photon absorptiometry. Each adult’s age and percentage of body fat are shown on the WeissStats site. a. Decide whether you can reasonably apply the regression t-test. If so, then also do part (b). b. Decide, at the 5% significance level, whether the data provide sufficient evidence to conclude that the predictor variable is useful for predicting the response variable.arrow_forward
 Calculus For The Life SciencesCalculusISBN:9780321964038Author:GREENWELL, Raymond N., RITCHEY, Nathan P., Lial, Margaret L.Publisher:Pearson Addison Wesley,
 Big Ideas Math A Bridge To Success Algebra 1: Stu...AlgebraISBN:9781680331141Author:HOUGHTON MIFFLIN HARCOURTPublisher:Houghton Mifflin Harcourt