
Concept explainers
Videos
a.
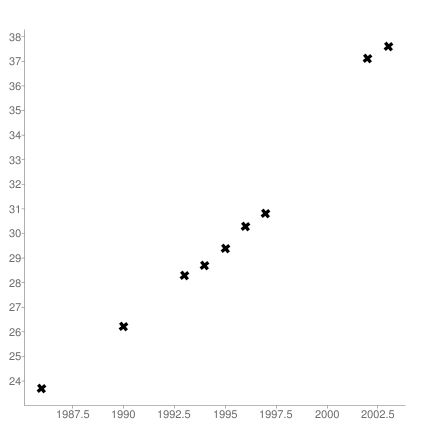
To graph: the data on the scatter plot.
a.
Answer to Problem 10E
Explanation of Solution
Given information:
The table of values given is as follows:
| Year (x) | Percentage of women in Professional Jobs (y) |
| 1986 | 23.7 |
| 1990 | 26.2 |
| 1993 | 28.3 |
| 1994 | 28.7 |
| 1995 | 29.4 |
| 1996 | 30.3 |
| 1997 | 30.8 |
| 2002 | 37.1 |
| 2003 | 37.6 |
| 2008 | ? |
Calculation:
The graph for the given data is shown below.

b.
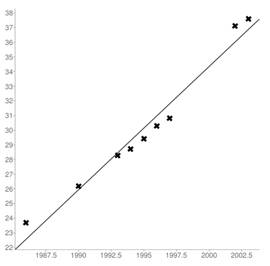
To find: best fit line using two ordered pairs.
b.
Answer to Problem 10E
Explanation of Solution
Given information:
The table of values given is as follows:
| Year (x) | Percentage of women in Professional Jobs (y) |
| 1986 | 23.7 |
| 1990 | 26.2 |
| 1993 | 28.3 |
| 1994 | 28.7 |
| 1995 | 29.4 |
| 1996 | 30.3 |
| 1997 | 30.8 |
| 2002 | 37.1 |
| 2003 | 37.6 |
| 2008 | ? |
Calculation:
Let’s select any two ordered pair like
Now, plug the value of m and any one point coordinate into the slope intercept equation and evaluate b as follows:
Now, plug the values of m and b in the slope intercept formula as follows:
Thus, the line equation is
c.
To find: the equation for regression line and
c.
Answer to Problem 10E
Explanation of Solution
Given information:
The table of values given is as follows:
| Year (x) | Percentage of women in Professional Jobs (y) |
| 1986 | 23.7 |
| 1990 | 26.2 |
| 1993 | 28.3 |
| 1994 | 28.7 |
| 1995 | 29.4 |
| 1996 | 30.3 |
| 1997 | 30.8 |
| 2002 | 37.1 |
| 2003 | 37.6 |
| 2008 | ? |
Calculation:
The graph for the above equation is as follows:
Using the graphing calculator, the regression line equation is as follows:
Using the graphing calculator, the
d.
To find: the missing value if regression line equation has strong or moderate relationship, and explains whether the prediction is reliable.
d.
Answer to Problem 10E
Prediction is unreliable.
Explanation of Solution
Given information:
The table of values given is as follows:
| Year (x) | Percentage of women in Professional Jobs (y) |
| 1986 | 23.7 |
| 1990 | 26.2 |
| 1993 | 28.3 |
| 1994 | 28.7 |
| 1995 | 29.4 |
| 1996 | 30.3 |
| 1997 | 30.8 |
| 2002 | 37.1 |
| 2003 | 37.6 |
| 2008 | ? |
Calculation:
The equation of regression line shows strong relationship because
Plugging
If 100% or more than that hold professional job, then there will be no women working for minimum wages. Only men will be working doing low wages jobs. The another possibility is that less and less women will hold jobs over the years. Unemployment will skyrocket and the few women who still have jobs, have managerial or professional jobs.
But this still doesn't account for the fact that the percentage will be larger than 100 fairly quickly. The regression line is completely unreliable, so any predictions made from it are also unreliable.
Chapter 1 Solutions
Advanced Mathematical Concepts: Precalculus with Applications, Student Edition
Additional Math Textbook Solutions
University Calculus: Early Transcendentals (4th Edition)
Calculus and Its Applications (11th Edition)
Precalculus (10th Edition)
Single Variable Calculus: Early Transcendentals (2nd Edition) - Standalone book


 Calculus: Early TranscendentalsCalculusISBN:9781285741550Author:James StewartPublisher:Cengage Learning
 Thomas' Calculus (14th Edition)CalculusISBN:9780134438986Author:Joel R. Hass, Christopher E. Heil, Maurice D. WeirPublisher:PEARSON
 Calculus: Early Transcendentals (3rd Edition)CalculusISBN:9780134763644Author:William L. Briggs, Lyle Cochran, Bernard Gillett, Eric SchulzPublisher:PEARSON
 Calculus: Early TranscendentalsCalculusISBN:9781319050740Author:Jon Rogawski, Colin Adams, Robert FranzosaPublisher:W. H. Freeman
 Calculus: Early Transcendental FunctionsCalculusISBN:9781337552516Author:Ron Larson, Bruce H. EdwardsPublisher:Cengage Learning