
Concept explainers
Videos
a.
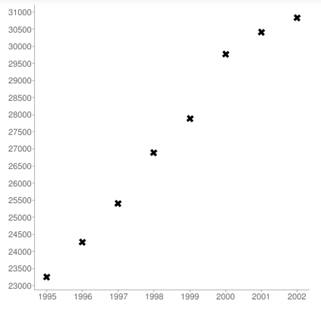
To graph: the data on the scatter plot.
a.
Answer to Problem 7E
Explanation of Solution
Given information:
The table of values given is as follows:
| Year (x) | Personal income in dollar (y) |
| 1995 | 23255 |
| 1996 | 24270 |
| 1997 | 25412 |
| 1998 | 26893 |
| 1999 | 27880 |
| 2000 | 29760 |
| 2001 | 30413 |
| 2002 | 30832 |
| 2010 | ? |
Calculation:
The graph for the given data is shown below.

b.
To find: best fit line using two ordered pairs.
b.
Answer to Problem 7E
Explanation of Solution
Given information:
The table of values given is as follows:
| Year (x) | Personal income in dollar (y) |
| 1995 | 23255 |
| 1996 | 24270 |
| 1997 | 25412 |
| 1998 | 26893 |
| 1999 | 27880 |
| 2000 | 29760 |
| 2001 | 30413 |
| 2002 | 30832 |
| 2010 | ? |
Calculation:
Let’s select any two ordered pair like
Now, plug the value of m and any one point coordinate into the slope intercept equation and evaluate b as follows:
Now, plug the values of m and b in the slope intercept formula as follows:
Thus, the line equation is
c.
To find: the equation for regression line and
c.
Answer to Problem 7E
Explanation of Solution
Given information:
The table of values given is as follows:
| Year (x) | Personal income in dollar (y) |
| 1995 | 23255 |
| 1996 | 24270 |
| 1997 | 25412 |
| 1998 | 26893 |
| 1999 | 27880 |
| 2000 | 29760 |
| 2001 | 30413 |
| 2002 | 30832 |
| 2010 | ? |
Calculation:
The graph for the above equation is as follows:
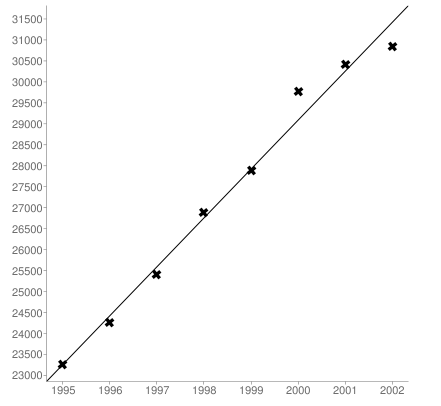
Using the graphing calculator, the regression line equation is as follows:
Using the graphing calculator, the
d.
To find: the missing value if regression line equation has strong or moderate relationship, and explains whether the prediction is reliable.
d.
Answer to Problem 7E
Prediction is reliable.
Explanation of Solution
Given information:
The table of values given is as follows:
| Year (x) | Personal income in dollar (y) |
| 1995 | 23255 |
| 1996 | 24270 |
| 1997 | 25412 |
| 1998 | 26893 |
| 1999 | 27880 |
| 2000 | 29760 |
| 2001 | 30413 |
| 2002 | 30832 |
| 2010 | ? |
Calculation:
The equation of regression line shows strong relationship because
Plugging
The regression line represents that the rate of increase in personal income per year is slower than that of inflation. On average, money doubles every seven years. As minimum wage does not increase quickly as compared to inflation and only a small fraction of the population has the large amount of money. So, this data seems reliable and the predicted value is also reliable.
Chapter 1 Solutions
Advanced Mathematical Concepts: Precalculus with Applications, Student Edition
Additional Math Textbook Solutions
University Calculus: Early Transcendentals (3rd Edition)
Thomas' Calculus: Early Transcendentals (14th Edition)
Precalculus (10th Edition)
Calculus: Early Transcendentals (2nd Edition)


 Calculus: Early TranscendentalsCalculusISBN:9781285741550Author:James StewartPublisher:Cengage Learning
 Thomas' Calculus (14th Edition)CalculusISBN:9780134438986Author:Joel R. Hass, Christopher E. Heil, Maurice D. WeirPublisher:PEARSON
 Calculus: Early Transcendentals (3rd Edition)CalculusISBN:9780134763644Author:William L. Briggs, Lyle Cochran, Bernard Gillett, Eric SchulzPublisher:PEARSON
 Calculus: Early TranscendentalsCalculusISBN:9781319050740Author:Jon Rogawski, Colin Adams, Robert FranzosaPublisher:W. H. Freeman
 Calculus: Early Transcendental FunctionsCalculusISBN:9781337552516Author:Ron Larson, Bruce H. EdwardsPublisher:Cengage Learning