
Videos
INTEGRATED CASE
NEW WORLD CHEMICALS INC.
FINANCIAL
Assume that you were recently hired as Wilson’s assistant and that your first major task is to help her develop the formal financial forecast. She asks you to begin by answering the following questions.
- a. Assume (1) that NWC was operating at full capacity in 2016 with respect to all assets, (2) that all assets must grow at the same rate as sales, (3) that accounts payable and accrued liabilities also will grow at the same rate as sales, and (4) that the 2016 profit margin and dividend payout will be maintained. Under those conditions, what would the AFN equation predict the company’s financial requirements to be for the coming year?
- b. Consultations with several key managers within NWC, including production, inventory, and receivable managers, have yielded some very useful information.
- 1. NWC’s high DSO is largely due to one significant customer who battled through some hardships the past 2 years but who appears to be financially healthy again and is generating strong cash flow. As a result, NWC’s
accounts receivable manager expects the Firm to lower receivables enough for a calculated DSO of 34 days without adversely affecting sales. - 2. NWC was operating slightly below capacity; but its forecasted growth will require a new facility, which is expected to increase NWC’s net Fixed assets to $700 million.
- 3. A relatively new inventory management system (installed last year) has taken some time to catch on and to operate efficiently. NWC’s inventory turnover improved slightly last year, but this year NWC expects even more improvement as inventories decrease and inventory turnover is expected to rise to 10×.
- 1. NWC’s high DSO is largely due to one significant customer who battled through some hardships the past 2 years but who appears to be financially healthy again and is generating strong cash flow. As a result, NWC’s
Incorporate that information into the 2017 initial forecast results, as these adjustments to the initial forecast represent the final forecast for 2017. (Hint: Total assets do not change from the initial forecast.)
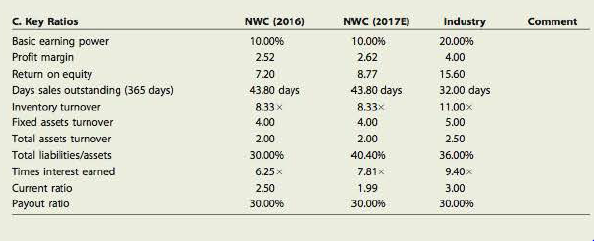
- c. Calculate NWC’s forecasted ratios based on its final forecast and compare them with the company’s 2016 historical ratios, the 2017 initial forecast ratios, and the industry averages. How does NWC compare with the average firm in its industry, and is the company’s financial position expected to improve during the coming year? Explain.
- d. Based on the final forecast, calculate NWC’s
free cash flow for 2017. How does this FCF differ from the FCF forecasted by NWC’s initial “business as usual” forecast? - e. Initially, some NWC managers questioned whether the new facility expansion was necessary, especially as it results in increasing net fixed assets from $500 million to $700 million (a 40% increase). However, after extensive discussions about NWC needing to position itself for future growth and being flexible and competitive in today’s marketplace, NWC’s top managers agreed that the expansion was necessary. Among the issues raised by opponents was that NWC’s fixed assets were being operated at only 85% of capacity. Assuming that its fixed assets were operating at only 85% of capacity, by how much could sales have increased, both in dollar terms and in percentage terms, before NWC reached full capacity?
- f. How would changes in the following items affect the AFN: (1) the dividend payout ratio, (2) the profit margin, (3) the capital intensity ratio, and (4) NWC beginning to buy from its suppliers on terms that permit it to pay after 60 days rather than after 30 days? (Consider each item separately and hold all other things constant.)
TABLE IC 16.1 Financial Statements and Other Data on NWC (Millions of Dollars)
| A. Balance Sheets | 2016 | 2017E |
| Cash and equivalents | $ 20 | $ 25 |
| Accounts receivable | 240 | 300 |
| Inventories | 240 | 300 |
| Total current assets | $ 500 | $ 625 |
| Net fixed assets | 500 | 625 |
| Total assets | $1,000 | $1,250 |
| Accounts payable and accrued liabilities | $ 100 | $ 125 |
| Notes payable | 100 | 190 |
| Total current liabilities | $ 200 | $ 315 |
| Long-term debt | 100 | 190 |
| Common stock | 500 | 500 |
| 200 | 245 | |
| Total liabilities and equity | $1,000 | $1.250 |
| B. Income Statements | 2016 | 2017E |
| Sales | $2,000.00 | $2,500.00 |
| Variable costs | 1,200.00 | 1,500.00 |
| Fixed costs | 700.00 | 875.00 |
| Earnings before interest and taxes (EBIT) | $ 100.00 | $ 125.00 |
| Interest | 16.00 | 16.00 |
| Earnings before taxes (EBT) | $ 84.00 | $ 109.00 |
| Taxes (40%) | 33.60 | 43.60 |
| Net income | $ 50.40 | $ 65.40 |
| Dividends (30%) | $ 15.12 | $ 19.62 |
| Addition to retained earnings | $ 35.28 | $ 45.78 |
a.
To calculate: Company’s financial requirements for 2017.
Additional Fund Needed:
Additional fund needed is also known as external financing needed. It is the state in which a company needed finance to increase its operation. Additional fund needed is a method in which a company raises the funds through external resources to increase its assets, which helps to increase the sales revenue of the company.
But according to additional fund needed method, a company do not change its financial ratio. Liabilities and retained earnings spontaneously increase with the increase in sales and assets.
Explanation of Solution
Computation of AFN equation for the year 2017,
Given,
Projected increase in assets is $250 million (working notes).
Spontaneous increase in liabilities is $25 million (working notes).
Increase in retained earnings is $45 million (working notes).
Formula to calculate the AFN equation,
Substitute $250 million for projected increase in assets, $25 million for spontaneous increase in liabilities and $45 million for increase in retained earnings.
Working notes:
Given,
Forecasted assets for 2017 are $1,250 million.
Assets for 2016 are $1,000 million.
Calculation of projected increase in assets,
Given,
Forecasted accounts payable and accrued liabilities for 2017 are $125 million.
Accounts payable and accrued liabilities for 2016 are $100 million.
Calculation of Spontaneous increase in liabilities,
Given,
Forecasted retained earnings for 2017 are $245 million.
Retained earnings for 2016 are $200 million.
Calculation of increase in retained earnings,
The additional funds needed for 2017 is $175 million.
b.
To determine: The final forecast for 2017 after the adjustment.
Balance Sheet:
Balance sheet is the summarize statement of total assets and total liabilities of a company in an accounting period. It is one of the financial statements.
Explanation of Solution
Final forecast for 2017 after the adjustment has been shown by preparing balance sheet.
| Company NWC | ||
| Balance Sheet | ||
| 2016 | 2017 | |
| Assets |
Amount (Millions of Dollars) |
Amount (Millions of Dollars) |
| Cash and equivalents | 20 | 79.5 |
| Account receivable | 240 | 233 |
| Inventories | 240 | 237.5 |
| Total current assets | 500 | 550 |
| Net fixed assets | 500 | 700 |
| Total assets | 1,000 | 1,250 |
| Liabilities and Owners' Equity | ||
|
Accounts payable and accrued liabilities | 100 | 125 |
| Notes payable | 100 | 190 |
| Total current liabilities | 200 | 315 |
| Long-term debt | 100 | 190 |
| Common stock | 500 | 500 |
| Retained earnings | 200 | 245 |
| Total liabilities and equity | 1,000 | 1,250 |
Table (1)
Working notes:
Calculation of Net fixed assets,
Given,
The company is expected to increase net fixed assets to $700 million.
So, the forecasted fixed assets for the year 2017 are $700 million.
Calculation of forecasted account receivable for the year 2017,
Given,
Total credit sales for 2017 are $2,500 million.
The DSO is 34 days.
Calculation of account receivable,
Calculation of forecasted cost of goods sold for the year 2017,
Given,
Forecasted fixed cost for the year 2017 is $1,500 million.
Forecasted variable cost for the year 2017 is $870 million.
Calculation of cost of goods sold,
Calculation of forecasted inventories for the year 2017 after the adjustment,
Given,
Cost of goods sold is $2,375 million.
The company is expected to raise its inventory turnover to 10 times.
Calculation of inventories,
Calculation of cash and equivalents for the year 2017 after the adjustment,
Given,
Total current assets for the year 2017 after adjustment are$550 million.
Inventory for the year 2017 after adjustment is $237.5 million.
Account receivable for the year 2017 after adjustment is $233 million.
Calculation of cash and cash equivalents,
c.
To calculate: Final forecasted ratio and compare the ratios with the ratios of 2016, initial forecasted ratio of 2017 and with industry ratio.
Current Ratio:
Current ratio is a measurement tool to identify that whether a company has enough current assets to repay its current liabilities or not.
Fixed Asset Turnover:
Fixed asset turnover is a measuring tool to identify that how a company generates its net sales through the efficient use of its fixed assets.
Total Asset Turnover:
Total asset turnover is a measuring tool to identify that how a company generates its net sales through the efficient use of total assets
Profit Margin:
The profit margin is also known as sales margin, as profit margin is the margin or profit calculated on sales revenue and is equal to the excess of sales over cost of goods sold.
Payout Ratio:
Payout ratio indicates the amount of dividend paid to the shareholders of a company from the net income generated by a company over a period of time.
Times Interest Earned Ratio:
It is a ratio that helps in measuring the company’s ability to pay off its interest through the income generated by a company before interest and tax. It tells that how much amount a company has to use to pay off its interest obligation.
Basic Earnings Ratio:
It is a ratio that helps in measuring that what is the company’s earning power before the effect of financial leverage and income tax on business.
Return on Equity:
It is a ratio that tells about the amount of company’s earnings from the amount invested by its shareholder on the equity.
Days Sales Outstanding:
Days sales outstanding mean the ratio to calculate the number of days a company needed to recover the amounts from its debtors.
Explanation of Solution
Calculation of forecasted ratio after adjustment,
Calculation of current ratio,
Given,
Total current assets after adjustment for 2017 are $550 million.
Total current liabilities for 2017 are $315 million.
Formula to calculate current ratio,
Substitute $550 million for current assets and $315 million for current liabilities.
Calculation of fixed assets turnover ratio,
Given,
Net sales for 2017 are $2,500 million.
Fixed assets for 2017 after adjustment are $700 million.
Formula to calculate fixed assets turnover ratio,
Substitute $2,500 million for net sales and $700 for fixed assets.
Comparison of company’s financial ratio
|
Company’s Key Ratios | 2016 |
2017 (initial) | 2017(final) | Industry |
| Basic earning power | 10.00% | 10.00% | 10.00% | 20.00% |
| Profit margin | 2.25 | 2.62 | 2.62 | 4.00 |
| Returns on equity | 7.20 | 8.77 | 8.77 | 15.60 |
| Days sales outstanding | 43.80 days | 43.80 days | 34 days | 32 days |
| Inventory turnover | 8.33
| 8.33
| 10
| 11.00
|
| Fixed assets turnover | 4.00 | 4.00 | 3.57 | 5.00 |
| Total assets turnover | 2.00 | 2.00 | 2.00 | 2.50 |
| Total liabilities/assets | 30.00% | 40.40% | 40.40% | 36.00% |
| Times interest earned | 6.25
| 7.81
| 7.81
| 9.40
|
| Current ratio | 2.50 | 1.99 | 1.75 | 3.00 |
| Payout ratio | 30.00% | 30.00% | 30.00% | 30.00% |
Table (2)
Yes, the financial position of the company is going to be improve in the next coming year. As the company is going to increase its total assets and the sales revenue.
- Basic earnings ratio reflects the company’s earning power before the effect of business income taxes and financial leverage is less than the industry, which is 10% in the year 2016,2017 (initial) and 2017 (final) and the of industry is 20%.
- Profit margin reflects that 2.62 % of company sales are its profit while the average of the industry is 4.00%.
- Returns on equity ratio indicates that in 2016 the company is generating 7.20% earned from the amount invested by shareholders while in 2017 it is 8.77% and the average of the industry it is 15.06%.
- Days sales outstanding ratio reflects the average collection period of the company in 2016 is 43.80 days, in 2017 initially it was 43.80 days while in 2017 after adjustment it is 34 days and the average of the industry is 32 days.
- Inventory turnover represent in 2016 company’s inventory is sold and replaced in 8.33 days, in 2017 initially it was 8.33 days , in 2017 after final adjustment, it is 10 days and the average of the industry it is 11 days.
- Fixed asset turnover ratio reflects the use of fixed assets to generate sales revenue. The high fixed asset turnover indicates the effective use of fixed assets to generate revenue which is 4% in the year 2016 and 2017 in initial and 3.57% in the year 2017 in the final and the average of the industry is 5%.
- Total asset turnover ratio reflects the use of total assets to generate sales revenue. The high total asset turnover indicates the effective use of total assets to generate revenue which is 2% of the company and 2.50% is the average of the industry.
- Total assets/liabilities indicate the amount of total assets provided by debts. The lower the ratio, the lower the debt of a company which is 30% in 2016, 40.40 in 2017 (initial) and 2017(final) and 36% is the average of the industry.
- Times interest earned ratio represents the company’s ability to pay off its interest from its earnings. The higher the ratio the higher the ability of company to pay off its interest by its earnings, which is 6.25 times in the year 2016, 7.81 in the year 2017 and 9.40 is the average of industry.
- Current ratio indicated the company’s ability to pay off its current liabilities by its current assets, which is 2.50 in the year 2016, 1.99 in the initial 2017, 1.75 in the final 2017 and 3.00 is the average of the industry.
- The payout ratio indicates the amount of dividend paidto the shareholders of a company from its earnings, which is 30% of the company as well as 30% is the average of the industry.
The company’s final forecasted current ratio is 1.75, fixed assets turnover ratio is 3.57, the inventory turnover ratio is 10 times and the days sale outstanding are 34 days. And the financial position of the company will improve in the coming year.
d.
To calculate: Final free cash flow for 2017 and compare with the initially forecasted cash flow for 2017.
Cash flow:
The net amount of cash and equivalents moving into and out of a business
Explanation of Solution
Calculation of cash and equivalents for the year 2017 after the adjustment,
Given,
Total current assets for the year 2017 after adjustment are$550 million.
Inventory for the year 2017 after adjustment is $237.5 million.
Account receivable for the year 2017 after adjustment is $233 million.
Formula to calculate cash and cash equivalents,
Substitute $550million for total current assets, $233 million for accounts receivable and $237.5 for inventories.
The initially cash forecasted cash flow for 2017 was $25 million.
Comparison of initial cash flow for 2017 and final cash flow for 2017.
The final cash flow of 2017 has been increase due to days sales outstanding has increase to 34 days, which means that the account receivable has been due and increases the amount of cash flow.
The final cash flow for 2017 is $79.5 million and the final cash flow has been increase as compare to initial cash flow.
e.
To calculate: Increase in sales in terms of dollars and % when fixed assets are operated at 100% capacity.
Explanation of Solution
Calculation of sales if fixed assets are operated at 100% capacity,
Given,
Sales for year 2016 are $2,000 million (Fixed assets are operated at 85% capacity).
Formula to calculate sales if fixed assets are operated at 100% capacity,
Substitute $2,000 million for sales at 85% capacity.
Calculation of % increase in sales,
Given,
Sales for year 2016 at 85% capacity are $2,000 million.
Sales for year 2016 at 100% capacity are $2,353 million.
Formula to calculate % increase in sales,
Substitute $2,353 million for sales at 100% capacity and $2,000 million for sales at 85% capacity.
The 17.65% sales or sales amounted to $2,353 million should be increase if the fixed assets are operated at 100% capacity.
f.
1.
To identify: The effect of dividend payout ratio on AFN.
Answer to Problem 16IC
The AFN will increase as an increase in the dividend payout ratio. If the dividend payout ratio remains constant and if a company wants to decrease its dividend payout ratio then the company does not need the additional funds.
Explanation of Solution
If the company wants to increase in the dividend payout ratio it means the company needs additional profit, which can only generate by increase in sales revenue and sales revenue only increase by the company has additional funds to increase its assets.
The AFN will increase as the dividend payout ratio is increase.
2.
To identify: The effect of profit margin on AFN.
Answer to Problem 16IC
Every company’s main motive is to increase its profit margin. The AFN will increase as increase in profit margin. If the profit margin remains constant,then the company does not need the additional funds.
Explanation of Solution
If the company wants to increase in profit margin it means the company needs additional sales revenue and sales revenue only increase by the company has additional funds to increase its assets.
The AFN will increase as the profit margin is increase.
3.
To identify: The effect of capital intensity ratio on AFN.
Capital Intensity Ratio:
The capital intensity ratio is the ratio to find the amount of capital a company needed to invest in its assets so that company has enough assets to meet its sales target. It helps to find out the amount of capital a company can invest into its assets.
Answer to Problem 16IC
The AFN will increase as the capital intensity ration will increase.
Explanation of Solution
It the company wants to increase its assets it means companiesneed addition capital to invest it inthe assets, so increase in the capital intensity ratio will increase the AFN.
The AFN will increase as increase in capital intensity ratio.
4.
To identify: The effect of suppliers permit to the company to pay after 60 days rather than 30 days.
Answer to Problem 16IC
The company does not need additional fund in this case.
Explanation of Solution
As the company gets extra time period to pay off to its suppliers than there is no requirement of additional fund to pay off the suppliers.
No AFN is required.
Want to see more full solutions like this?
Chapter 16 Solutions
Bundle: Fundamentals of Financial Management, Concise, Loose-Leaf Version, 9th + LMS Integrated for MindTap Finance, 1 term (6 months) Printed Access Card


- Integrated Case NEW WORLD CHEMICALS INC. 16-16 FINANCIAL FORECASTING Sue Wilson, the new financial manager of New World Chemicals (NWC), a California producer of specialized chemicals for use in fruit orchards, must prepare a formal financial forecast for 2015. NWCs 2014 sales were 2 billon, and the marketing department is forecasting a 25% increase for 2015. Wilson thinks the company was operating at full capacity in 2014, but she is not sure. The first step in her forecast was to assume that key ratios would remain unchanged and that it would be business as usual at NWC The 2014 financial statements, the 2015 initial forecast, and a ratio analysis for 2014 and the 2015 initial forecast are given in Table 1C 16.1. Assume that you were recently hired as Wilsons assistant and that your first major task is to help her develop the formal financial forecast. She asks you to begin by answering the following questions. a. Assume (1) that NWC was operating at full capacity in 2014 with respect to all assets. (2) that all assets must grow at the same rate as sales. (3) that accounts payable and accrued liabilities also will grow at the same rate as sales, and (4) that the 2014 profit margin and dividend payout will be maintained. Under those conditions, what would the AFN equation predict the company's financial requirements to be for the coming year? b. Consultations with several key managers within NWC, including production, inventory, and receivable managers, have yielded some very useful information. 1. NWCs high DSO is largely due to one significant customer who battled through some hardships the past 2 years but who appears to be financially healthy again and is generating strong cash flow. As a result, NWCs accounts receivable manager expects the firm to lower receivables enough for a calculated DSO of 34 days without adversely affecting sales. 2. NWC was operating slightly below capacity; but its forecasted growth will require a new facility, which is expected to increase NWC's net fixed assets to 700 million. 3. A relatively new inventory management system (installed last year) has taken some time to catch on and to operate efficiently. NWC's inventory turnover improved slightly last year, but this year NWC expects even more improvement as inventories decrease and inventory turnover is expected to rise to 10 . Incorporate that information into the 2015 initial forecast results, as these adjustments to the initial forecast represent the final forecast for 2015. (Hint: Total assets do not change from the initial forecast.) c. Calculate NWCs forecasted ratios based on its final forecast and compare them with the companys 2014 historical ratios, the 2015 initial forecast ratios, and the industry averages. How does NWC compare with the average firm in its industry, and is the companys financial position expected to improve during the coming year? Explain. d. Based on the final forecast, calculate NWCs free cash flow for 2015. How does this FCF differ from the POP forecasted by NWC's initial business as usual forecast? e. Initially, some NWL managers questioned whether the new iacility expansion was necessary, especially as it results in increasing net fixed assets from 500 million to 700 million (a 40% increase). However, after extensive discussions about NWC needing to position itself for future growth and being flexible and competitive in todays marketplace, NWCs top managers agreed that the expansion was necessary. Among the issues raised by opponents was that NWCs fixed assets were being operated at only 85% of capacity. Assuming that its fixed assets were operating at only 85% of capacity, by how much could sales have increased, both in dollar terms and in percentage terms, before NWC reached full capacity? f. How would changes in the following items affect the AFN: (1) the dividend payout ratio, (2) the profit margin, (3) the capital intensity ratio, and (4) NWC beginning to buy from its suppliers on terms that permit it to pay after 60 days rather than after 30 days? (Consider each item separately and hold all other things constant) Financial Statements and Other Data on NWC (Millions of Dollars) Table 1C 16.1 A. Balance Sheets 2014 2015E Cash and equivalents 20 25 Accounts receivable 240 300 Inventories 240 300 Total current assets S 500 625 Net fixed assets 500 625 Total assets 1,000 1,250 Accounts payable and accrued liabilities 100 125 Notes payable 100 190 Total current liabilities 200 315 Long-term debt 100 190 Common stock 500 500 Retained earnings 200 245 Total liabilities and equity 1,000 1,250 B. Income Statements 2014 2015E Sales 2,000.00 2,500.00 Variable costs 1,200.00 1,500.00 Fixed costs 700.00 875.00 Earnings before interest and taxes (EBIT) 100.00 125.00 Interest 16.00 16.00 Earnings before taxes (EBT) 84.00 109.00 Taxes (40%) 33.60 43.60 Net income 50.40 65.40 Dividends (30%) 15.12 19.62 Addition to retained earnings 35.28 45.78 C. Key Ratios NWC (2014) NWC (2015E) Industry Comment Basic earning power 10.00% 10.00% 20.00% Profit margin 232 2.62 4.00 Return on equity 7.20 8.77 15.60 Days sales outstanding (365 days) 43.80 days 43.80 days 32.00 days Inventory turnover 8.33 8.33 11.00 Fixed assets turnover 4.00 4.00 5.00 Total assets turnover 2.00 2.00 2.50 Total 1iabi1ities/Assets 30.00% 40.40% 36.00% Times interest earned 6.25 7.81 9.40 Current ratio 2.50 1.99 3.00 Payout ratio 30.00% 30.00% 30.00%arrow_forwardForecasted Statements and Ratios Upton Computers makes bulk purchases of small computers, stocks them in conveniently located warehouses, ships them to its chain of retail stores, and has a staff to advise customers and help them set up their new computers. Uptons balance sheet as of December 31, 2018, is shown here (millions of dollars): Sales for 2018 were 350 million, and net income for the year was 10.5 million, so the firms profit margin was 3.0%. Upton paid dividends of 4.2 million to common stockholders, so its payout ratio was 40%. Its tax rate was 40%, and it operated at full capacity. Assume that all assets/sales ratios, (spontaneous liabilities)/sales ratios, the profit margin, and the payout ratio remain constant in 2019. a. If sales are projected to increase by 70 million, or 20%, during 2019, use the AFN equation to determine Uptons projected external capital requirements. b. Using the AFN equation, determine Uptons self-supporting growth rate. That is, what is the maximum growth rate the firm can achieve without having to employ nonspontaneous external funds? c. Use the forecasted financial statement method to forecast Uptons balance sheet for December 31, 2019. Assume that all additional external capital is raised as a line of credit at the end of the year and is reflected (because the debt is added at the end of the year, there will be no additional interest expense due to the new debt). Assume Uptons profit margin and dividend payout ratio will be the same in 2019 as they were in 2018. What is the amount of the line of credit reported on the 2019 forecasted balance sheets? (Hint: You dont need to forecast the income statements because the line of credit is taken out on the last day of the year and you are given the projected sales, profit margin, and dividend payout ratio; these figures allow you to calculate the 2019 addition to retained earnings for the balance sheet without actually constructing a full income statement.)arrow_forwardMANAGEMENT ACCOUNTING Gxsport is a small business manufactures sportswear focusing on tracksuits. Gxsportperform very well in 2021 with yearly sales amounting to RM630,000, equivalent to 12,600pieces sold. For the 1st quarter of 2022, the sales are predicted to increase by 7% ascompared to 2021’s sales due to the raised of awareness for a healthy lifestyle.The price of the tracksuit is RM50 per piece. The labour rate is RM7 per hour and eachpiece of tracksuit requires 0.4 hours to make. Manufacturing overheads are charges atRM1.50 per piece. The inventory is expected to have a balance of 500 pieces of tracksuitsas at 1st January 2022 and increase by 10% as at 31st March 2022.Calculate the production budget (in unit) for the 1st quarter 2022 (1st January to 31st March2022).arrow_forward
- Please answer in detail CarniTrin is a manufacturer of Carnival costumes in a highly competitive market. The company's management team is seeking guidance on the use of financial performance measures to identify the key drivers of the company's financial performance and develop a strategy to improve it. The following data relate to the company for the year 2022: In its clothing division, the company has $6,000,000 invested in assets. After-tax operating income from sales of clothing in 2022 is $900,000. Income for the clothing division has grown steadily over the last few years. The cosmetics division has $14,000,000 invested in assets and an after-tax operating income in 2022 of $1,900,000. The weighted-average cost of capital for CarniTrin is 10% and the 2021’s after-tax return on investment for each division was 15%. The general manager of CarniTrin has asserted that in the future, managers should have their compensation structure aligned with their performance measures…arrow_forwardZNet Co. is a web-based retail company. The company reports the following for the past year. The company’s CEO believes that sales for next year will increase by 20% and both profit margin (%) and the level of average invested assets will be the same as for the past year. 1. Compute return on investment for the past year. 2. Compute profit margin for the past year. 3. If the CEO’s forecast is correct, what will return on investment equal for next year? 4. If the CEO’s forecast is correct, what will investment turnover equal for next year? Sales . $5,000,000 Operating income . $1,000,000 Average invested assets . $12,500,000arrow_forwardFinancial Projection CALMS Ice Cream Delight The current business plan is indicated to require a budget of approximately $70,000 to manage the operational and functional activities of CALMS Ice Cream Delight. The prominent sources of finances are bank loans and the involvement of potential investors. As a bank loan is a suitable alternative for newly established businesses, CALMS Ice Cream Delight intends to obtain one to handle continuing financial activity as this provides numerous benefits, such as inferior interest rates and venture capital which will enable the business to initiate sufficiently. . In addition, the CALMS Ice Cream Delight will also incorporate potential investors privately to mitigate the associated risk factors and gain funding regardless of the concerns related to enterprise success or failure. The business is determined to acquire both types of finances, having the proportion of 50% for each. The start-up summary is prepared for business which is placed in an…arrow_forward
- Ethical Situation: What Would You Do? Discussion Question As one of the newer district sales managers for a fast-growing technology company, you've asked your salespeople to give you three sales forecasts in their territories for the coming year: (a) optimistic, (b) pessimistic, and (c) most likely. After totaling their three different sales forecasts, you realize that the optimistic forecast will increase sales by nearly 20% in your district, the pessimistic forecast by 10%, and the most likely by about 15%. Your national sales manager has asked each district sales manager to give her their most likely sales forecast for the coming year, so she can assign sales quotas. Your thoughts are that it's probably best to give her the most pessimistic sales forecast because this should help ensure that she assigns your district a quota that you should easily achieve. If you can exceed your assigned district sales quota by a substantial amount, you'll probably get a large bonus, and you may…arrow_forwardCarniTrin is a manufacturer of Carnival costumes in a highly competitive market. Thecompany's management team is seeking guidance on the use of financial performancemeasures to identify the key drivers of the company's financial performance and develop astrategy to improve it.The following data relate to the company for the year 2022: In its clothing division, the company has $6,000,000 invested in assets. After-taxoperating income from sales of clothing in 2022 is $900,000. Income for the clothingdivision has grown steadily over the last few years. The cosmetics division has $14,000,000 invested in assets and an after-tax operatingincome in 2022 of $1,900,000. The weighted-average cost of capital for CarniTrin is 10% and the 2021’s after-taxreturn on investment for each division was 15%. The general manager of CarniTrin has asserted that in the future, managers shouldhave their compensation structure aligned with their performance measures with nofixed salaries. However, the…arrow_forwardCarniTrin is a manufacturer of Carnival costumes in a highly competitive market. Thecompany's management team is seeking guidance on the use of financial performancemeasures to identify the key drivers of the company's financial performance and develop astrategy to improve it. The following data relate to the company for the year 2022: In its clothing division, the company has $6,000,000 invested in assets. After-taxoperating income from sales of clothing in 2022 is $900,000. Income for the clothingdivision has grown steadily over the last few years. The cosmetics division has $14,000,000 invested in assets and an after-tax operatingincome in 2022 of $1,900,000. The weighted-average cost of capital for CarniTrin is 10% and the 2021’s after-taxreturn on investment for each division was 15%. The general manager of CarniTrin has asserted that in the future, managers shouldhave their compensation structure aligned with their performance measures with nofixed salaries.…arrow_forward
- CarniTrin is a manufacturer of Carnival costumes in a highly competitive market. Thecompany's management team is seeking guidance on the use of financial performancemeasures to identify the key drivers of the company's financial performance and develop astrategy to improve it. The following data relate to the company for the year 2022: In its clothing division, the company has $6,000,000 invested in assets. After-taxoperating income from sales of clothing in 2022 is $900,000. Income for the clothingdivision has grown steadily over the last few years. The cosmetics division has $14,000,000 invested in assets and an after-tax operatingincome in 2022 of $1,900,000. The weighted-average cost of capital for CarniTrin is 10% and the 2021’s after-taxreturn on investment for each division was 15%. The general manager of CarniTrin has asserted that in the future, managers shouldhave their compensation structure aligned with their performance measures with nofixed salaries. However, the…arrow_forwardPro forma income statement The marketing department of Metroline Manufacturing estimates that its sales in 2020 will be $1.59 million. Interest expense is expected to remain unchanged at $36,000, and the firm plans to pay $66,000 in cash dividends during 2020. Metroline Manufacturing's income statement for the year ended December 31, 2019, is given LOADING... , along with a breakdown of the firm's cost of goods sold and operating expenses into their fixed and variable components. a. Use the percent-of-sales method to prepare a pro forma income statement for the year ended December 31, 2020. b. Use fixed and variable cost data to develop a pro forma income statement for the year ended December 31, 2020. c. Compare and contrast the statements developed in parts a. and b. Which statement probably provides the better estimate of 2020 income? Explain why.arrow_forwardSmith Branded Apparel designs T-shirts for businesses and corporations. The accounting managerhas presented the latest quarter’s return on sales of 10% and asset turnover of 1.5. What is the company’s current return on investment (ROI)?arrow_forward

 Intermediate Financial Management (MindTap Course...FinanceISBN:9781337395083Author:Eugene F. Brigham, Phillip R. DavesPublisher:Cengage Learning
 Financial Accounting: The Impact on Decision Make...AccountingISBN:9781305654174Author:Gary A. Porter, Curtis L. NortonPublisher:Cengage Learning
 Fundamentals of Financial Management, Concise Edi...FinanceISBN:9781305635937Author:Eugene F. Brigham, Joel F. HoustonPublisher:Cengage Learning
 Fundamentals of Financial Management, Concise Edi...FinanceISBN:9781285065137Author:Eugene F. Brigham, Joel F. HoustonPublisher:Cengage Learning