
Videos
How have stocks performed in the past? The following table presents the data stored in Stock Performance, which show the performance of a broad measure of stock performance (by percentage (by per percentage) for each decade from the 1830s through the 2000s:
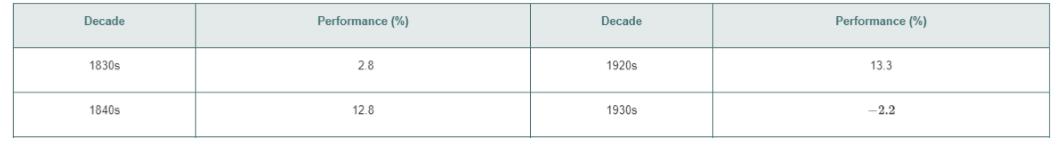
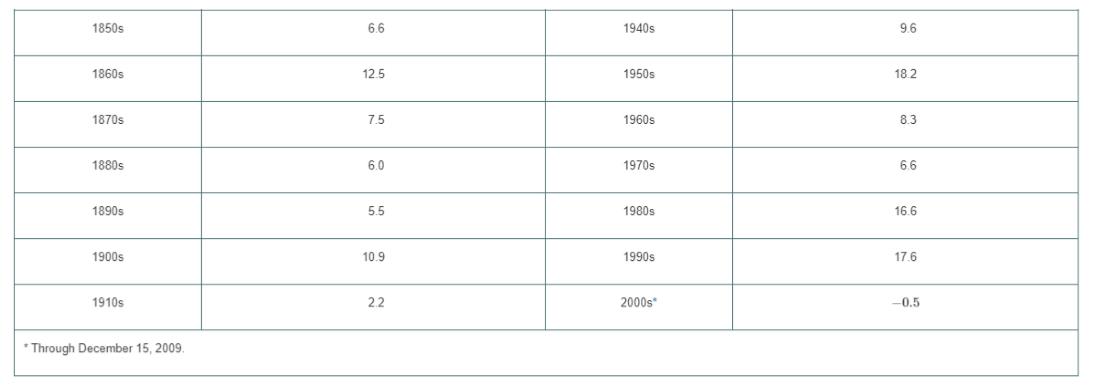
a. Plot the time series.
b. Fit a three-period moving average to the data and plot the results.
c. Using a smoothing coefficient of
d. What is your exponentially smoothed forecast for the 2010s?
e. Repeat (c) and (d), using
f. Compare the results of (d) and (e).
g. What conclusions can you reach concerning how stock have performed in the past?
Want to see the full answer?
Check out a sample textbook solution
Chapter 16 Solutions
Basic Business Statistics, Student Value Edition


- With what kind of exponential model would doubling time be associated? What role does doubling time play in these models?arrow_forwardTable 6 shows the population, in thousands, of harbor seals in the Wadden Sea over the years 1997 to 2012. a. Let x represent time in years starting with x=0 for the year 1997. Let y represent the number of seals in thousands. Use logistic regression to fit a model to these data. b. Use the model to predict the seal population for the year 2020. c. To the nearest whole number, what is the limiting value of this model?arrow_forwardSuppose that the initial size of a population is n0 and the population grows exponentially. Let n(t) be the size of the population at time t. (a) Write a formula for n(t) in terms of the doubling time a. (b) Write a formula for n(t) in terms of the relative growth rate r.arrow_forward
- Suppose an investment account is opened with aninitial deposit of 10,500 earning 6.25 interest,compounded continuously. How much will theaccount be warm after 25 years?arrow_forwardSales of a video game released in the year 2000 took off at first, but then steadily slowed as time moved on. Table 4 shows the number of games sold, in thousands, from the years 20002010. a. Let x represent time in years starting with x=1 for the year 2000. Let y represent the number of games sold in thousands. Use logarithmic regression to fit a model to these data. b. If games continue to sell at this rate, how many games will sell in 2015? Round to the nearest thousand.arrow_forwardAn investment account was opened with aninitial deposit of 9,600 and earns 7.4 interest,compounded continuously. How much will theaccount be worth after 15 years?arrow_forward

 Algebra & Trigonometry with Analytic GeometryAlgebraISBN:9781133382119Author:SwokowskiPublisher:Cengage
 Algebra and Trigonometry (MindTap Course List)AlgebraISBN:9781305071742Author:James Stewart, Lothar Redlin, Saleem WatsonPublisher:Cengage Learning
 College AlgebraAlgebraISBN:9781305115545Author:James Stewart, Lothar Redlin, Saleem WatsonPublisher:Cengage Learning
 Big Ideas Math A Bridge To Success Algebra 1: Stu...AlgebraISBN:9781680331141Author:HOUGHTON MIFFLIN HARCOURTPublisher:Houghton Mifflin Harcourt
 Trigonometry (MindTap Course List)TrigonometryISBN:9781337278461Author:Ron LarsonPublisher:Cengage Learning