
Bundle: Introduction to Statistics and Data Analysis, 5th + WebAssign Printed Access Card: Peck/Olsen/Devore. 5th Edition, Single-Term
5th Edition
ISBN: 9781305620711
Author: Roxy Peck, Chris Olsen, Jay L. Devore
Publisher: Cengage Learning
expand_more
expand_more
format_list_bulleted
Videos
Textbook Question
Chapter 16.2, Problem 9E
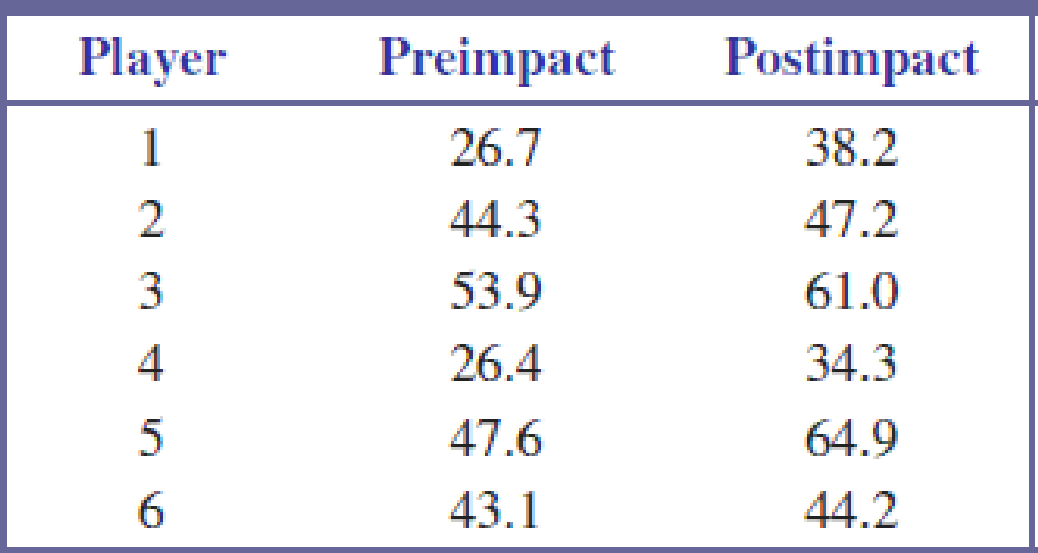
Peak force (N) on the hand was measured just prior to impact and just after impact on a backhand drive for six advanced tennis players. The resulting data, from the paper “Forces on the Hand in the Tennis One-Handed Backhand” (International Journal of Sport Biomechanics [1991]: 282–292), are given in the accompanying table.
Use the signed-rank test to determine if the
Expert Solution & Answer

Trending nowThis is a popular solution!

Students have asked these similar questions
Refer to laserjeans.xlsx to answer the questions below. These real data come from Ondogan, Z., Pamuk, O., Ondogan, E. N., & Ozguney, A. (2005). Improving the appearance of all textile products from clothing to home textile using laser technology. Optics and Laser Technology, 37, 631-637. Researchers sought to test the differences in tensile strength of jeans designed by hand versus those designed with lasers. 1. What type of measurement scale do each of the five variables use? 2. Create histograms for those that are continuous (interval or ratio). How would you describe the shape of these distributions? 3. A textile researcher wants to simplify the strength data by turning this continuous variable into an ordinal variable with 10 equal interval widths. Given that the lowest force resulting in a rip was 860 N, and the greatest force resulting in a rip was 1,450 N, what should the interval widths (also called bins or breaks) be? Fill in the second column of the…
Suppose the National Transportation Safety Board (NTSB) wants to examine the safety of compact cars, midsize cars, and full-size cars. It collects a sample of three for each of the treatments (cars types). Using the hypothetical data provided below, run your analyses in R to test whether the mean pressure applied to the driver’s head during a crash test is equal for each types of car (higher pressure = less safe).
Compact Car
Midsize Car
Full-Size Car
643
469
484
655
427
456
702
525
402
What kind of statistical analysis do you need to use and why?
State the null and alternative hypotheses.
Check your assumptions. Include screenshots of your R output and explain why each of them are or are not met.
Using R, run your analysis and include a screenshot.
Using R, run post-hoc tests and include a screenshot.
What do you conclude about the null hypothesis?
What does each of your p-values tell you? Are there differences and in which comparisons?…
Ankle Brachial Index. The ankle brachial index (ABI) compares the blood pressure of a patient’s arm to the blood pressure of the patient’s leg. The ABI can be an indicator of different diseases, including arterial diseases. A healthy (or normal) ABI is 0.9 or greater. In a study by M. McDermott et al. titled “Sex Differences in Peripheral Arterial Disease: Leg Symptoms and Physical Functioning” (Journal of the American Geriatrics Society, Vol. 51, No. 2, pp. 222–228), the researchers obtained the ABI of 187 women with peripheral arterial disease. The results were a mean ABI of 0.64 with a standard deviation of 0.15. At the 1% significance level, do the data provide sufficient evidence to conclude that, on average, women with peripheral arterial disease have an unhealthy ABI?
Chapter 16 Solutions
Bundle: Introduction to Statistics and Data Analysis, 5th + WebAssign Printed Access Card: Peck/Olsen/Devore. 5th Edition, Single-Term
Ch. 16.1 - Urinary fluoride concentration (in parts per...Ch. 16.1 - Prob. 2ECh. 16.1 - Prob. 3ECh. 16.1 - A blood lead level of 70 mg/ml has been commonly...Ch. 16.1 - The effectiveness of antidepressants in treating...Ch. 16.1 - Prob. 6ECh. 16.1 - Prob. 7ECh. 16.2 - The effect of a restricted diet in the treatment...Ch. 16.2 - Peak force (N) on the hand was measured just prior...Ch. 16.2 - In an experiment to study the way in which...
Ch. 16.2 - Prob. 11ECh. 16.2 - Prob. 12ECh. 16.2 - Prob. 13ECh. 16.2 - Prob. 14ECh. 16.2 - Prob. 15ECh. 16.2 - Prob. 16ECh. 16.2 - Prob. 17ECh. 16.2 - The signed-rank test can be adapted for use in...Ch. 16.3 - Prob. 19ECh. 16.3 - Prob. 20ECh. 16.3 - The given data on phosphorus concentration in...Ch. 16.3 - Prob. 22ECh. 16.3 - Prob. 23ECh. 16.3 - The following data on amount of food consumed (g)...Ch. 16.3 - The article Effect of Storage Temperature on the...
Knowledge Booster


Learn more about
Need a deep-dive on the concept behind this application? Look no further. Learn more about this topic, statistics and related others by exploring similar questions and additional content below.Similar questions
- Do wearable devices that monitor diet and physical activity help people lose weight? Researchers had 237 subjects who were already involved in a program of diet and exercise use wearable technology for 24 months. They measured their weight (in kilograms) before using the technology and 24 months after using the technology. The 237 differences in weight (weight after 24 months minus weight before using the wearable technology) had x = -3.5 and s = 7.8. Let u be the mean weight difference. 41 John M. Jakicic et al., "Effect of wearable technology combined with a lifestyle intervention on long-term weight loss, the IDEA randomized clinical trial," JAMA, 316, 2016, pp. 1161-1171. O Macmillan Learning " What is the test statistic? Give your answer to three decimal places. What is the P-value? The P-value is between 0.01 and 0.05. The P-value is less than 0.0005. O The P-value is between 0.0005 and 0.01. The P-value is greater than 0.05.arrow_forwardWhat am I supposed to do here?arrow_forwardshow full work for psych statsarrow_forward
- The compressive strength, in kilopascals, was measured for concrete blocks from five different batches of concrete, both three and six days after pouring. The data are presented in the following table. Batch 3 1352 4 1341 1376 5 1327 1358 1316 1355 After 3 days After 6 days 1373 1366 1384 Can you conclude that the mean strength after six days is greater than the mean strength after three days?arrow_forward"Durable press" cotton fabrics are treated to improve their recovery from wrinkles after washing. "Wrinkle recovery angle" measures how well a fabric recovers from wrinkles. Higher is better. Here are data on the wrinkle recovery angle (in degrees) for two types of treated fabrics: Permafresh 15 12 16 13 11 14 10 Hylite 16 20 18 15 19 A manufacturer wants to know how large is the difference in mean wrinkle recovery angle. Give a 90% confidence interval for the difference in mean wrinkle recovery angle: [three decimal accuracy] [three decimal accuracy]arrow_forwardFoot ulcers are a common problem for people with diabetes. Higher skin temperatures on the foot indicate an increased risk of ulcers. The article "An Intelligent Insole for Diabetic Patients with the Loss of Protective Sensation" (Kimberly Anderson, M.S. Thesis, Colorado School of Mines), reports measurements of temperatures, in °F, of both feet for 181 diabetic patients. The results are presented in the following table. Left Foot Right Foot 80 80 85 85 75 80 88 86 89 87 87 82 78 78 88 89 89 90 76 81 89 86 87 82 78 78 80 81 87 82 86 85 76 80 88 89 Construct a scatterplot of the right foot temperature (y) versus the left foot temperature (x). Verify that a linear model is appropriate. b. Compute the least-squares line for predicting the right foot temperature from the left foot temperature. If the left foot temperatures of two patients differ by 2 degrees, by how much would you predict their right foot temperatures to differ? Predict the right foot temperature for a patient whose left…arrow_forward
- Evans conducted a study to determine if the frequency and characteristics of pediatric problems in elderly patients with diabetes present differences with respect to patients of the same age, but without diabetes. The individuals studied, interned in a clinic, were between 70 and 90 years old. Among the researchers' findings are the following statistics. with respect to the scores on the deep tendon reflexes meters:Sample without Diabetes: 79 / 2.1 / 1.1With Diabetes: 74 / 1.6 / 1.2Is it possible to conclude, based on the data, that, on average, diabetic patients they have reduced deep tendon reflexes in comparison with patients without diabetes of the same age?arrow_forward54. Grip is applied to produce normal surface forces that compress the object being gripped. Examples include two people shaking hands, or a nurse squeezing a patient's forearm to stop bleeding. The article "Investigation of Grip Force, Normal Force, Contact Area, Hand Size, and Handle Size for Cylindrical Handles" (Human Factors, 2008: 734-744) included the following data on grip strength (N) for a sample of 42 individuals: 16 18 18 26 33 41 54 56 66 68 87 91 95 98 106 109 111 118 127 127 135 145 147 149 151 168 172 183 189 190 200 210 220 229 230 233 238 244 259 294 329 403 a. Construct a stem-and-leaf display based on repeat- ing each stem value twice, and comment on inter- esting features. b. Determine the values of the fourths and the fourthspread. c. Construct a boxplot based on the five-number sum- mary, and comment on its features. 5arrow_forwardSuppose the National Transportation Safety Board (NTSB) wants to examine the safety of compact cars, midsize cars, and full-size cars. It collects a sample of three for each of the treatments (cars types). Using the hypothetical data provided below, test whether the mean pressure applied to the driver's head during a crash test is equal for each types of car. Use a = 0.05, ssw=6300 and SST=6350. 1) The null and the alternative hypotheses are : a) Ho: H1 = H2 = Hg. H: At most one of uj:j = 1,2,3 is different. H : At least one of u;:j = 1,2,3 is different. H: At least one of H;:j = 1,2,3 is different. H: 41 = 42 = Hz. vs b) Ho: 41 = H2 = Hg. Vs %3D Vs d) Ho: At least one of u;:j = 1,2,3 is different. %3D VS 2) The F test statistics= a) 0.0228 b) 0.0218 c) 0.0208 d) 0.0238 3) The critical value = a) 4.3433 b) 5.5433 c) 5.1433 d) 5.3433 4) The decision of the test is: a) Do not reject Ho. There is insufficient evidence that at least one of the population means is different. b) Reject Hg.…arrow_forward
- Why would we want to use a Chi Squared Test for this study? What are the best ways to describe the data graphically and numerically? An investigation of the association between drink preferences and the color of teeth is proposed. Subjects will be surveyed as to the type of drink most often consumed (coffee/tea. Juice, caramel-colored soda, water, or milk). A clinical exam will be performed after dental cleaning to determine the color of the teeth (reddish brown, reddish yellow, gray, reddish gray).arrow_forwardDetermine if there is an association between the cognitive strategy, cognitive reflectivity and the gray matter density of the ventral medial prefrontal cortex in the 22 participants? Here is a link to the data set collected by the researchers. Plot the data and calculate the correlation coefficient (r). Report your answer rounded to two decimal places. Use the Statistical Table C found in the Beetle Book on page 709-710 to find the critical t-value (0.05). Use formulas, functions, and the data analysis tool pack in Excel to avoid accruing rounding errors. Useful functions include =TDIST(t value,degrees of freedom,tails) to produce a p value for any type of a t-test from a data set =SQRT((1-r)/degrees of freedom) to produce the standard error of the correlation coefficient from a calculated correlation coefficient (r) statistic =CORREL(array1, array2) to produce a r value from a calculated correlation coefficient statistic =IF(t value < critical t,"reject","accept") to…arrow_forward"Durable press" cotton fabrics are treated to improve their recovery from wrinkles after washing. "Wrinkle recovery angle" measures how well a fabric recovers from wrinkles. Higher is better. Here are data on the wrinkle recovery angle (in degrees) for two types of treated fabrics: Permafresh Hylite 16 16 14 19 10 20 11 14 13 18 12 15 15 A manufacturer wants to know how large is the difference in mean wrinkle recovery angle.Give a 95% confidence interval for the difference in mean wrinkle recovery angle: ( , ) [three decimal accuracy] [three decimal accuracy]arrow_forward
arrow_back_ios
SEE MORE QUESTIONS
arrow_forward_ios
Recommended textbooks for you
 Glencoe Algebra 1, Student Edition, 9780079039897...AlgebraISBN:9780079039897Author:CarterPublisher:McGraw Hill
 Big Ideas Math A Bridge To Success Algebra 1: Stu...AlgebraISBN:9781680331141Author:HOUGHTON MIFFLIN HARCOURTPublisher:Houghton Mifflin Harcourt
Glencoe Algebra 1, Student Edition, 9780079039897...
Algebra
ISBN:9780079039897
Author:Carter
Publisher:McGraw Hill
Big Ideas Math A Bridge To Success Algebra 1: Stu...
Algebra
ISBN:9781680331141
Author:HOUGHTON MIFFLIN HARCOURT
Publisher:Houghton Mifflin Harcourt
Hypothesis Testing using Confidence Interval Approach; Author: BUM2413 Applied Statistics UMP;https://www.youtube.com/watch?v=Hq1l3e9pLyY;License: Standard YouTube License, CC-BY
Hypothesis Testing - Difference of Two Means - Student's -Distribution & Normal Distribution; Author: The Organic Chemistry Tutor;https://www.youtube.com/watch?v=UcZwyzwWU7o;License: Standard Youtube License