
Bundle: Introduction to Statistics and Data Analysis, 5th + WebAssign Printed Access Card: Peck/Olsen/Devore. 5th Edition, Single-Term
5th Edition
ISBN: 9781305620711
Author: Roxy Peck, Chris Olsen, Jay L. Devore
Publisher: Cengage Learning
expand_more
expand_more
format_list_bulleted
Videos
Textbook Question
Chapter 16.3, Problem 21E
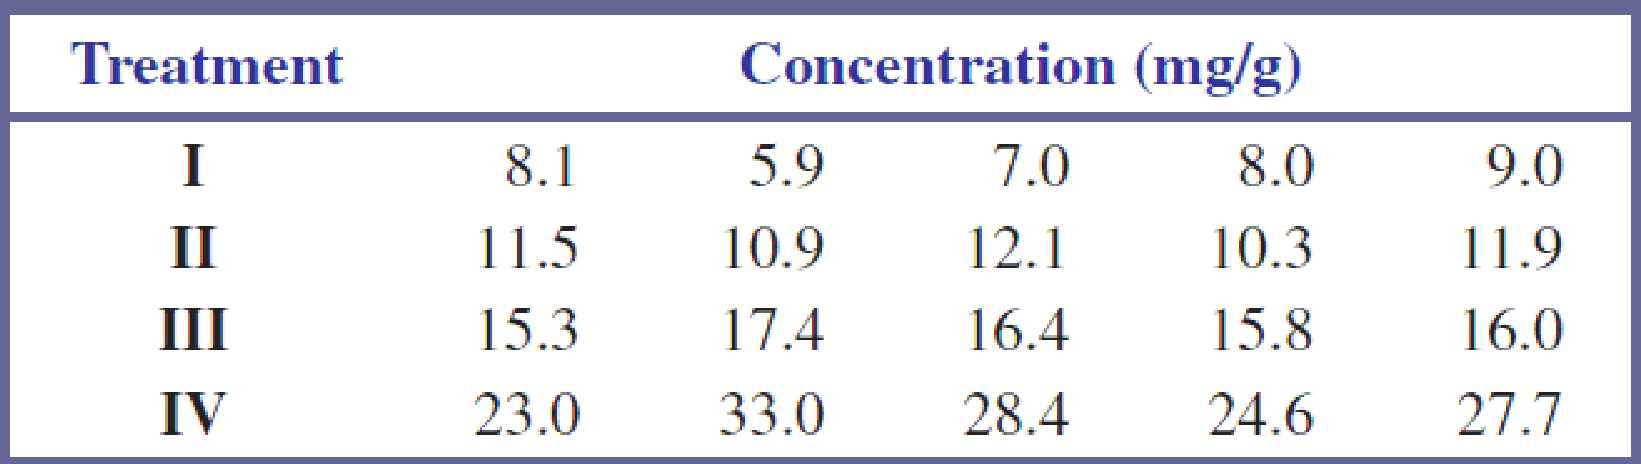
The given data on phosphorus concentration in topsoil for four different soil treatments appeared in the article “Fertilisers for Lotus and Clover Establishments on a Sequence of Acid Soils on the East Otago Uplands” (New Zealand Journal of Experimental Agriculture [1984]: 119–129).
Use the KW test and a 0.01 significance level to test the null hypothesis of no difference in true
Expert Solution & Answer

Trending nowThis is a popular solution!

Students have asked these similar questions
Suppose the National Transportation Safety Board (NTSB) wants to examine the safety of
compact cars, midsize cars, and full-size cars. It collects a sample of three for each of the
treatments (cars types). Using the hypothetical data provided below, test whether the mean
pressure applied to the driver’s head during a crash test is equal for each types of car. Use α = 5%.
Compact cars
Midsize cars
Full-size cars
643
469
484
655
427
456
702
525
402
Mean
666.67
473.67
447.33
Standard deviation
31.18
49.17
41.68
Dr. Maddan's eye drops are supposed to cause significant reduction is eye redness. The following table shows the
results of a recent study where a random sample of individuals took part in a placebo controlled study.
No Reduction
in Redness
Reduction in
Redness
Total
Eye Drops
120
220
340
No Eye Drops Total
120
140
260
240
360
600
With 5% level of significance, determine if eye redness reduction is dependent upon taking the eye drops. Provide,
a. the Chi-square statistic.
b. the critical value or the p-value.
c. Your decision on whether or not to reject Ho.
Suppose the National Transportation Safety Board (NTSB) wants to examine the safety of compact cars, midsize cars, and full-size cars. It collects a sample of three for each of the treatments (cars types). Using the hypothetical data provided below, test whether the mean pressure applied to the driver’s head during a crash test is equal for each types of car. Use α = 5%.
Compact
Midsize
Full-size
643
655
702
680
672
469
427
525
495
483
484
465
402
476
435
State the null and alternate hypothesis for the data.
Given the results, what will be the conclusion of the team?
Chapter 16 Solutions
Bundle: Introduction to Statistics and Data Analysis, 5th + WebAssign Printed Access Card: Peck/Olsen/Devore. 5th Edition, Single-Term
Ch. 16.1 - Urinary fluoride concentration (in parts per...Ch. 16.1 - Prob. 2ECh. 16.1 - Prob. 3ECh. 16.1 - A blood lead level of 70 mg/ml has been commonly...Ch. 16.1 - The effectiveness of antidepressants in treating...Ch. 16.1 - Prob. 6ECh. 16.1 - Prob. 7ECh. 16.2 - The effect of a restricted diet in the treatment...Ch. 16.2 - Peak force (N) on the hand was measured just prior...Ch. 16.2 - In an experiment to study the way in which...
Ch. 16.2 - Prob. 11ECh. 16.2 - Prob. 12ECh. 16.2 - Prob. 13ECh. 16.2 - Prob. 14ECh. 16.2 - Prob. 15ECh. 16.2 - Prob. 16ECh. 16.2 - Prob. 17ECh. 16.2 - The signed-rank test can be adapted for use in...Ch. 16.3 - Prob. 19ECh. 16.3 - Prob. 20ECh. 16.3 - The given data on phosphorus concentration in...Ch. 16.3 - Prob. 22ECh. 16.3 - Prob. 23ECh. 16.3 - The following data on amount of food consumed (g)...Ch. 16.3 - The article Effect of Storage Temperature on the...
Knowledge Booster


Learn more about
Need a deep-dive on the concept behind this application? Look no further. Learn more about this topic, statistics and related others by exploring similar questions and additional content below.Similar questions
- The yield of alfalfa from a random sample of six test plots is 1.4, 1.6, 0.9, 1.9, 2.2,and 1.2 tons per acre. Assume the data can be looked upon as a sample from anormal population. Test at the 0.05 level of significance whether this supports thecontention that the average yield for this kind of alfalfa is 1.5 tones per acre.arrow_forwardSuppose the National Transportation Safety Board (NTSB) wants to examine the safety of compact cars, midsize cars, and full-size cars. It collects a sample of three for each of the treatments (cars types). Using the hypothetical data provided below, test whether the mean pressure applied to the driver’s head during a crash test is equal for each types of car. Use α = .05. Use a post hoc test to determine which pairs of mean are significantly different. Explain in what way are they different. Car: Compact Midsize Full-size 1 643 469 484 2 655 427 456 3 702 525 402 M 666.67 473.67 447.33 s 31.18 49.17 41.68 SS 1944.39 4835. 38 3474.45 Source SS df MS F Between 86049.556 2 43024.778 25.1749 Within 10254.22 6 1709.0367 Total 96303.776 8arrow_forward6) The following data summarize the results from an independent-measures study comparing three treatment conditions. Treatment II 3. 6. N= 12 10 G = 60 1 10 EX = 392 1 5. 6. M = 3 M = 4 M= 8 T= 12 T= 16 T= 32 SS = 8 SS = 12 SS = 16 a) Use an ANOVA with a = .05 to determine whether there are any significant differences among the three treatment means. b) Calculate n² to measure the effect size for this study. c) Write a sentence demonstrating how a research report would present the results of the hypothesis test and the measure of effect size. 3.arrow_forward
- Three samples of each of three types of PVC pipe of equal wall thickness are tested to failure under three temperature conditions, yielding the results shown below. Research questions: Is mean burst strength affected by temperature and/or by pipe type? Is there a “best” brand of PVC pipe? Burst Strength of PVC Pipes (psi) Temperature PVC1 PVC2 PVC3 Hot (70º C) 247 299 239 277 287 262 283 275 279 Warm (40º C) 325 341 297 322 319 315 296 335 304 Cool (10º C) 358 375 327 366 352 334 338 359 340 Click here for the Excel Data File (a-1) Choose the correct row-effect hypotheses. a. H0: A1 ≠ A2 ≠ A3 ≠ 0 ⇐⇐ Temperature means differ H1: All the Aj are equal to zero ⇐⇐ Temperature means are the same b. H0: A1 = A2 = A3 = 0 ⇐⇐ Temperature means are the same H1: Not all the Aj are equal to zero ⇐⇐ Temperature means differ a b (a-2) Choose the correct column-effect hypotheses. a. H0: B1 ≠ B2 ≠ B3 ≠ 0 ⇐⇐…arrow_forwardConsider two sets of data, X and Y, with n = 10 observations each. If the mean ranks for X and Y are 6 and 5, respectively, what is the test statistic for the Wilcoxon Signed-Ranks test on these two sets of data?arrow_forwardThe article “Arsenic and Mercury in Lake Whitefish and Burbot Near the Abandoned Giant Mine on Great Slave Lake” (P. Cott, B. Zajdlik, et al., Journal of Great Lakes Research, 2016:223–232) presents measurements of arsenic concentrations in fish found in Northern Canada. In a sample of 8 whitefish caught in Yellowknife Bay, the mean arsenic concentration in the liver was 0.32 mg/kg, with a standard deviation of 0.05 mg/kg. Can you conclude that the mean arsenic concentration in whitefish in Yellowknife Bay is greater than 0.3 mg/kg?arrow_forward
- 1. A study compared the number of tree species in unlogged forest plots to similar plots logged 8 years earlier. Independent random samples of both logged and unlogged plots were analyzed and the number of tree species was recorded. Tables 1 and 2 present the Shapiro-Wilk normality test for both types of forest plots and the Independent Samples t-test results. Use the information presented in these tables to answer the questions. Table 1: Tests of Normality Tests of Normality Kolmogorov-Smirnov Shapiro-Wilk Forest Plot Statistic df Sig. Statistic df Sig. Tree_Species Logged .181 12 .200 .936 12 .444 Unlogged .110 14 .200 .945 14 .480 *. This is a lower bound of the true significance. a. Lilliefors Significance Correction Table 2: Independent Samples Test Independent Samples Test Levene's Test for Equality of Variances t-test for Equality of Means 95% Confidence Interval of the Difference Mean Std. Error F Sig. t df Sig. (2-tailed) Difference Difference Lower Upper Equal variances…arrow_forwardQ No.5) Four different paints are advertised as having the same drying time. To check the manufacturer's claim, five samples of each paint were tested. The time in minutes until the paint was dry enough for a second coat to be applied was recorded. The following data were obtained. Paint 1 Paint 2 Paint 3 Paint 4 128 144 133 150 137 133 143 142 135 142 137 135 124 146 136 140 141 130 131 153 At the 0.05 level of significance, test to see whether the mean drying time is the same for each type of paint.arrow_forward
arrow_back_ios
arrow_forward_ios
Recommended textbooks for you
 Glencoe Algebra 1, Student Edition, 9780079039897...AlgebraISBN:9780079039897Author:CarterPublisher:McGraw Hill
Glencoe Algebra 1, Student Edition, 9780079039897...
Algebra
ISBN:9780079039897
Author:Carter
Publisher:McGraw Hill
Introduction to experimental design and analysis of variance (ANOVA); Author: Dr. Bharatendra Rai;https://www.youtube.com/watch?v=vSFo1MwLoxU;License: Standard YouTube License, CC-BY