
Concept explainers
Videos
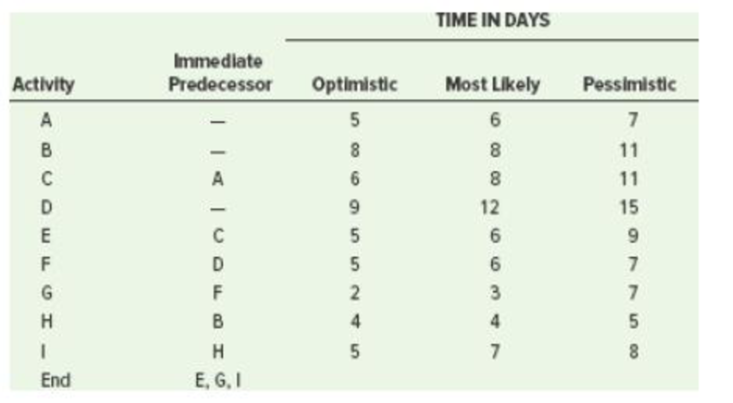
Three recent college graduates have formed a partnership and have opened an advertising firm. Their first project consists of activities listed in the following table.
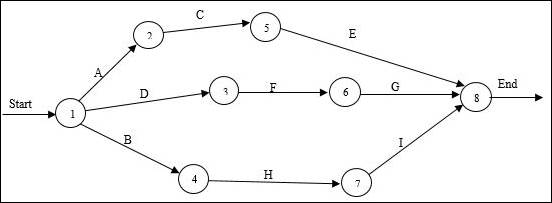
a. Draw the precedence diagram.
b. What is the probability that the project can be completed in 24 days or less? In 21 days or less?
c. Suppose it is now the end of the seventh day and that activities A and B have been completed while activity D is 50 percent completed. Time estimates for the completion of activity D are 5, 6, and 7. Activities C and H are ready to begin. Determine the probability of finishing the project by day 24 and the probability of finishing by day 21.
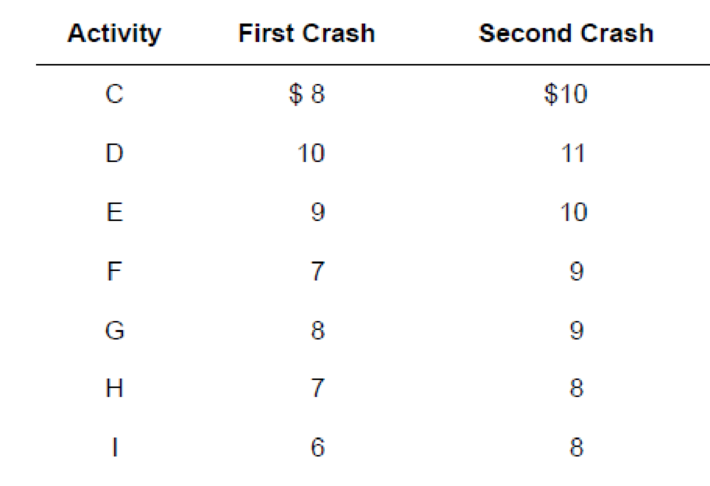
d. The partners have decided that shortening the project by two days would be beneficial, as long as it doesn’t cost more than about $20,000. They have estimated the daily crashing costs for each activity in thousands, as shown in the following table. Which activities should be crashed, and what further analysis would they probably want to do?
a)
To draw: A precedence diagram.
Answer to Problem 7P
Precedence diagram:
Explanation of Solution
Given information:
| Activity | Immediate Predecessor | Optimistic time | Most likely time | Pessimistic time |
| A | 5 | 6 | 7 | |
| B | 8 | 8 | 11 | |
| C | A | 6 | 8 | 11 |
| D | 9 | 12 | 15 | |
| E | C | 5 | 6 | 9 |
| F | D | 5 | 6 | 7 |
| G | F | 2 | 3 | 7 |
| H | B | 4 | 4 | 5 |
| I | H | 5 | 7 | 8 |
| End | E, G, I |
| Activity | First crash | Second crash |
| C | $ 8.00 | $ 10.00 |
| D | $ 10.00 | $ 11.00 |
| E | $ 9.00 | $ 10.00 |
| F | $ 7.00 | $ 9.00 |
| G | $ 8.00 | $ 9.00 |
| H | $ 7.00 | $ 8.00 |
| I | $ 6.00 | $ 8.00 |
Precedence diagram:
The precedence diagram is drawn from the first task till the last task. The activities are placed from left to right. The directions are represented with arrows to indicate the relationship between activities. The arrows are represented with the activity name.
b)
To determine: The probability at which the projected can be completed in 24 days or less and 21 days or less.
Answer to Problem 7P
24 days or less = 0.9686
21 days or less = 0.2350
Explanation of Solution
Given information:
| Activity | Immediate Predecessor | Optimistic time | Most likely time | Pessimistic time |
| A | 5 | 6 | 7 | |
| B | 8 | 8 | 11 | |
| C | A | 6 | 8 | 11 |
| D | 9 | 12 | 15 | |
| E | C | 5 | 6 | 9 |
| F | D | 5 | 6 | 7 |
| G | F | 2 | 3 | 7 |
| H | B | 4 | 4 | 5 |
| I | H | 5 | 7 | 8 |
| End | E, G, I |
| Activity | First crash | Second crash |
| C | $ 8.00 | $ 10.00 |
| D | $ 10.00 | $ 11.00 |
| E | $ 9.00 | $ 10.00 |
| F | $ 7.00 | $ 9.00 |
| G | $ 8.00 | $ 9.00 |
| H | $ 7.00 | $ 8.00 |
| I | $ 6.00 | $ 8.00 |
Formula to calculate expected time and variance:
Calculation of expected time and variance:
| Activity | Optimistic time | Most likely time | Pessimistic time | Expected time | Standard deviation | Variance |
| A | B | C | (A+(4*B)+C)/6 | (C-A)/6 | (C-A)^2/6^2 | |
| A | 5 | 6 | 7 | 6 | 0.333 | 0.111 |
| B | 8 | 8 | 11 | 8.5 | 0.500 | 0.250 |
| C | 6 | 8 | 11 | 8.17 | 0.833 | 0.694 |
| D | 9 | 12 | 15 | 12 | 1.000 | 1.000 |
| E | 5 | 6 | 9 | 6.33 | 0.667 | 0.444 |
| F | 5 | 6 | 7 | 6 | 0.333 | 0.111 |
| G | 2 | 3 | 7 | 3.5 | 0.833 | 0.694 |
| H | 4 | 4 | 5 | 4.17 | 0.167 | 0.028 |
| I | 5 | 7 | 8 | 6.83 | 0.500 | 0.250 |
Calculation of expected duration, variance and standard deviation for each path:
A-C-E:
D-F-G:
B-H-I:
Calculation of z value for all paths:
Formula:
24 days or less:
A-C-E:
Since z value is greater than +3.00, probability of completion is 1.00.
D-F-G:
From the standard normal distribution table,
The probability value for (z = 1.86) is 0.9686.
B-H-I:
Since z value is greater than +3.00, probability of completion is 1.00.
Probability of completion in 24 days or less:
The probability at which the project can be completed in 24 days or less is 0.9686.
21 days or less:
A-C-E:
From the standard normal distribution table,
The probability value for (z = 0.45) is 0.6736.
D-F-G:
From the standard normal distribution table,
The probability value for (z = -0.37) is 0.3557.
B-H-I:
From the standard normal distribution table,
The probability value for (z = 2.07) is 0.9808.
Probability of completion in 21 days or less:
The probability at which the project can be completed in 21 days or less is 0.2350.
c)
To determine: The probability of completing the project by day 24 and day 21.
Answer to Problem 7P
Day 24 = 0.9328
Day 21 = 0.0186
Explanation of Solution
Given information:
- At the end of 7th day activities A and B are completed and D is 50% completed.
- Time estimates of activity D completion are 5, 6 and 7.
- Activities C and H are ready to begin.
| Activity | Immediate Predecessor | Optimistic time | Most likely time | Pessimistic time |
| A | 5 | 6 | 7 | |
| B | 8 | 8 | 11 | |
| C | A | 6 | 8 | 11 |
| D | 5 | 6 | 7 | |
| E | C | 5 | 6 | 9 |
| F | D | 5 | 6 | 7 |
| G | F | 2 | 3 | 7 |
| H | B | 4 | 4 | 5 |
| I | H | 5 | 7 | 8 |
| End | E, G, I |
| Activity | First crash | Second crash |
| C | $ 8.00 | $ 10.00 |
| D | $ 10.00 | $ 11.00 |
| E | $ 9.00 | $ 10.00 |
| F | $ 7.00 | $ 9.00 |
| G | $ 8.00 | $ 9.00 |
| H | $ 7.00 | $ 8.00 |
| I | $ 6.00 | $ 8.00 |
Formula to calculate expected time and variance:
Calculation of expected time and variance:
| Activity | Optimistic time | Most likely time | Pessimistic time | Expected time | Standard deviation | Variance |
| A | B | C | (A+(4*B)+C)/6 | (C-A)/6 | (C-A)^2/6^2 | |
| A | 5 | 6 | 7 | 6 | 0.333 | 0.111 |
| B | 8 | 8 | 11 | 8.5 | 0.500 | 0.250 |
| C | 6 | 8 | 11 | 8.17 | 0.833 | 0.694 |
| D | 5 | 6 | 7 | 6 | 0.333 | 0.111 |
| E | 5 | 6 | 9 | 6.33 | 0.667 | 0.444 |
| F | 5 | 6 | 7 | 6 | 0.333 | 0.111 |
| G | 2 | 3 | 7 | 3.5 | 0.833 | 0.694 |
| H | 4 | 4 | 5 | 4.17 | 0.167 | 0.028 |
| I | 5 | 7 | 8 | 6.83 | 0.500 | 0.250 |
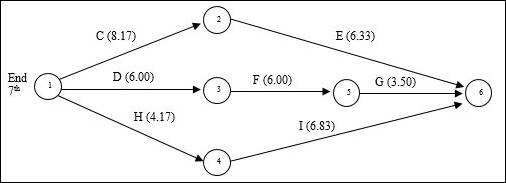
Revised project diagram:
Calculation of expected duration, variance and standard deviation for each path:
C-E:
D-F-G:
H-I:
Calculation of z value for all paths:
Formula:
24 days or less:
C-E:
From the standard normal distribution table,
The probability value for (z = 2.34) is 0.9904.
D-F-G:
From the standard normal distribution table,
The probability value for (z = 1.57) is 0.9418.
H-I:
Since z value is greater than +3.00, probability of completion is 1.00.
Probability of completion in 24 days or less:
The probability at which the project can be completed in 24 days is 0.9328.
21 days or less:
C-E:
From the standard normal distribution table,
The probability value for (z = -0.47) is 0.3192.
D-F-G:
From the standard normal distribution table,
The probability value for (z = -1.57) is 0.0582.
H-I:
Since z value is greater than +3.00, probability of completion is 1.00.
Probability of completion in 21 days or less:
The probability at which the project can be completed in 21 days is 0.0186.
d)
To determine: The activities that should be crashed and further analysis.
Explanation of Solution
Given information:
- The partners want to shorten the project by 2 days as long as the cost is not more than $20,000.
| Activity | Immediate Predecessor | Optimistic time | Most likely time | Pessimistic time |
| A | 5 | 6 | 7 | |
| B | 8 | 8 | 11 | |
| C | A | 6 | 8 | 11 |
| D | 5 | 6 | 7 | |
| E | C | 5 | 6 | 9 |
| F | D | 5 | 6 | 7 |
| G | F | 2 | 3 | 7 |
| H | B | 4 | 4 | 5 |
| I | H | 5 | 7 | 8 |
| End | E, G, I |
| Activity | First crash | Second crash |
| C | $ 8.00 | $ 10.00 |
| D | $ 10.00 | $ 11.00 |
| E | $ 9.00 | $ 10.00 |
| F | $ 7.00 | $ 9.00 |
| G | $ 8.00 | $ 9.00 |
| H | $ 7.00 | $ 8.00 |
| I | $ 6.00 | $ 8.00 |
Paths and expected duration:
| Paths | Expected Duration |
| C-E | 21.50 |
| D-F-G | 22.50 |
| H-I | 18.00 |
The critical path is D – F – G.
The activities are crashed based on the cost of crash given.
| Activity | Cost |
| F | $7 |
| G | $8 |
| D | $10 |
Step 1:
Activity F has the lowest crashing cost ($7,000) and will be crashed first for 1 day. The expected duration of D-F-G will be 21.50 days.
Step 2:
| Path | Expected Duration |
| C-E | 21.50 |
| D-F-G | 21.50 |
| H-I | 18.00 |
Now there are two critical paths C-E and D-F-G.
The critical activities are arranged in the order of low crash costs.
| Path | Activity | Cost |
| C-E | C | $8 |
| F | $9 |
| Path | Activity | Cost |
| D-F-G | D | $8 |
| F | $9 | |
| G | $10 |
One activity in each path is chosen to crash.
Activity C is crashed for 1 day since it has the lowest crashing cost ($8,000) on path C-E. The expected duration of path C-E is now 20.50 days.
Activity G is crashed for 1 day since it has the lowest crashing cost ($8,000) on path D-F-G. The expected duration of path D-F-G is now 20.50 days.
Calculation of total crashing cost:
The total cost of crashing is over the budget of $20,000 ($23,000 > $20,000). Hence, the partners will have to determine if crashing the project by 1 day or 2 days is really beneficial or not.
Want to see more full solutions like this?
Chapter 17 Solutions
EBK OPERATIONS MANAGEMENT


- 1. Assume that the activity time estimates (in days) for the swimming pool construction project in Problem 11 are as follows: a. What are the critical activities? b. What is the expected time to complete the project? c. Based only on the critical path, what is the estimated probability that the project can be completed in 25 or fewer days?arrow_forwardWhich of the following questions regarding a project CANNOT be answered even if the critical path of a project is known? * A. How long can each of the activities be delayed without delaying the project? B.When is the earliest project completion time? C. Which activities should not be delayed? D. None of the abovearrow_forwardI need assistance with the following questions in: Project Scheduling. This is a follow up to a question answered earlier. Question 1) was answered. 1) A company decides to plan a project, with activities, precedences and deterministic durations given in the following table: Activity i Duration (days) Immediate Predecessors A 32 none B 21 none C 30 none D 45 A E 26 A, B F 28 C G 20 E, F 2) The company decided that the project in the previous problem has to be expedited in order to optimize (minimize) the project cost. Expediting can be used to trade direct cost for indirect cost, since expediting the project reduces the indirect cost of the project by a fixed amount per day, while expediting an activity increases its total direct cost. The Accounting Department found that indirect costs amount to $100 per day, while activity direct costs as well as their normal and expedited times are given in the table below.…arrow_forward
- You may need to use the appropriate technology to answer this question. Mueller & Associates is a urban planning firm that is designing a new public park in an Omaha suburb. Coordination of the architect and subcontractors will require a major effort to meet the 43-week completion date requested by the owner. The Mueller project manager prepared the following project network. A project network with 10 activities and 14 directed arcs is shown. Activity Start is connected to activity A. Activity A is connected to activity B, to activity C, and to activity D. Activity B is connected to activity F. Activity C is connected to activity E and to activity F. Activity D is connected to activity E. Activity E is connected to activity G and to activity Finish. Activity F is connected to activity G and to activity H. Activity G is connected to activity H. Activity H is connected to activity Finish. Activity Finish has no arcs directed to other activities. Estimates of the optimistic, most…arrow_forwardYou may need to use the appropriate technology to answer this question. Mueller & Associates is a urban planning firm that is designing a new public park in an Omaha suburb. Coordination of the architect and subcontractors will require a major effort to meet the 43-week completion date requested by the owner. The Mueller project manager prepared the following project network. A project network with 10 activities and 14 directed arcs is shown. Activity Start is connected to activity A. Activity A is connected to activity B, to activity C, and to activity D. Activity B is connected to activity F. Activity C is connected to activity E and to activity F. Activity D is connected to activity E. Activity E is connected to activity G and to activity Finish. Activity F is connected to activity G and to activity H. Activity G is connected to activity H. Activity H is connected to activity Finish. Activity Finish has no arcs directed to other activities. Estimates of the optimistic, most…arrow_forwardWhich of the following questions regarding a project CANNOT beanswered even if the critical path of a project is known? A. How long can each of the activities be delayed without delaying the project?B. When is the earliest project completion time?C. Which activities should not be delayed?D. None of the abovearrow_forward
- Key: A is optimist time, M is the most likely time and B is the pessimistic time. i). Calculate the expected time for each activity ii. Draw a Gantt Chart from the same information above iii. State the critical path and the maximum number of weeks the project will take to be completed. iv. Discuss the pros and cons of using the Gantt chart as a planning and scheduling tool?arrow_forwardAns c. The earliest starting time for activity H is 15 days Ans d. The latest start time for activity J is 25 days. Ans e. The critical path is A-B-H-I-L-M with the minimum duration of the project as 28 days This is a follow up question please do f and garrow_forwardRecently, you were assigned to manage a project to remodelthe seminar room for your company. You have constructed anetwork diagram depicting the various activities in the project(Figure 7.13). In addition, you have asked your team to estimatethe amount of time that they would expect each of the activitiesto take. Their responses are shown in the following table: a. What is the expected completion time of the project?b. What is the probability of completing the project in 21 days?c. What is the probability of completing the project in 17 days?arrow_forward
- Please, I need help because I have no idea how to do any of these. 11. Building a backyard swimming pool consists of nine major activities. The activities and their immediate predecessors are shown. Develop the project network. For question number 12, you need to refer to question number 11. Also the first picture is for #11 and second picture(image) is for #12 12. Assume that the activity time estimates (in days) for the swimming pool construction project in Problem 11 are as follows: a. What are the critical activities? b. What is the expected time to complete the project? c. Based only on the critical path, what is the estimated probability that the project can be completed in 25 or fewer days?arrow_forwardA project has the activity duration and cost information indicated in the table where all times are in weeks. What is the total cost for completing this project in 50 days? Activity Predecessor Normal Time Normal Cost Crash Time Crash Cost A -- 8 $12,000 5 $21,000 B A 12 $20,000 9 $30,000 C A 15 $24,000 10 $60,000 D B 3 $10,000 2 $15,000 E C 9 $17,000 6 $34,000 F E 7 $5,000 6 $6,000 G D 8 $14,000 6 $20,000 H A 12 $22,000 10 $30,000 I H 6 $50,000 5 $55,000 J F, G, I 11 $33,000 9 $50,000arrow_forwardSuppose you have a project with a Budget at Completion (BAC) of $250,000 and a projected length of 10 months. After tracking the project for six months, you have collected the information in the table below. a. Complete the table. How do Earned Value SPI (based on $) and Earned Schedule SPI differ? b. Calculate the schedule variances for the project for both Earned Value and Earned Schedule. How do the values differ?arrow_forward
 Practical Management ScienceOperations ManagementISBN:9781337406659Author:WINSTON, Wayne L.Publisher:Cengage,
 Operations ManagementOperations ManagementISBN:9781259667473Author:William J StevensonPublisher:McGraw-Hill Education
 Operations and Supply Chain Management (Mcgraw-hi...Operations ManagementISBN:9781259666100Author:F. Robert Jacobs, Richard B ChasePublisher:McGraw-Hill Education
 Purchasing and Supply Chain ManagementOperations ManagementISBN:9781285869681Author:Robert M. Monczka, Robert B. Handfield, Larry C. Giunipero, James L. PattersonPublisher:Cengage Learning
 Production and Operations Analysis, Seventh Editi...Operations ManagementISBN:9781478623069Author:Steven Nahmias, Tava Lennon OlsenPublisher:Waveland Press, Inc.