Intermediate Accounting
9th Edition
ISBN: 9781259722660
Author: J. David Spiceland, Mark W. Nelson, Wayne M Thomas
Publisher: McGraw-Hill Education
expand_more
expand_more
format_list_bulleted
Videos
Textbook Question
Chapter 18, Problem 18.24E
Profitability ratio
• LO18–1
Comparative balance sheets for Softech Canvas Goods for 2018 and 2017 are shown below. Softech pays no dividends and instead reinvests all earnings for future growth.
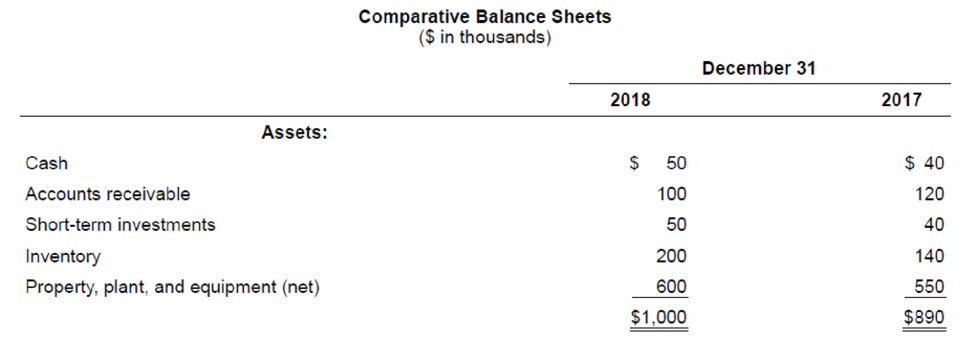
Liabilities and Shareholders’ Equity:
| Current liabilities | $ 240 | $210 |
| Bonds payable | 160 | 160 |
| Paid-in capital | 400 | 400 |
| 200 | 120 | |
| $1,000 | $890 |
Required:
1. Determine the return on shareholders’ equity for 2018.
2. What does the ratio measure?
Expert Solution & Answer
Want to see the full answer?
Check out a sample textbook solution
Students have asked these similar questions
Calculate return on assets and profit margin.LO9
The following information is available for Ware Ltd for 2018: sales revenue $7 840 000; cost of sales $3 528 000; profit $1 176 000; total equity $2 233 300; average total assets $5 113 000. Calculate the return on assets and profit margin for Ware Ltd for 2018.
Homemade Leverage [LO1] The Day Company and the KnightCompany are identical in every respect except that Day is notlevered. Financial information for the two firms appears in thefollowing table. All earnings streams are perpetuities, and neitherfirm pays taxes. Both firms distribute all earnings available tocommon stockholders immediately.Day KnightProjected operating income $ 375,000 $ 375,000Year-end interest on debt — $ 54,000Market value of stock $2,300,000 $1,650,000Market value of debt — $ 900,000An investor who can borrow at 6 percent per year wishes topurchase 5 percent of Knight’s equity. Can he increase hisdollar return by purchasing 5 percent of Day’s equity if heborrows so that the initial net costs of the strategies are thesame?Given the two investment strategies in (a), which willinvestors choose? When will this process cease?
Ch. 16. LMNOP Corporation uses no debt. The weighted average cost of capital is 9.2 percent. If the current market value of the equity is $31.7 million and there are no taxes, what is EBIT?
Round to the nearest dollar and format as "X,XXX,XXX"
Chapter 18 Solutions
Intermediate Accounting
Ch. 18 - Identify and briefly describe the two primary...Ch. 18 - Prob. 18.2QCh. 18 - Prob. 18.3QCh. 18 - Prob. 18.4QCh. 18 - Prob. 18.5QCh. 18 - Prob. 18.6QCh. 18 - Prob. 18.7QCh. 18 - What is meant by a shareholders preemptive right?Ch. 18 - Terminology varies in the way companies...Ch. 18 - Most preferred shares are cumulative. Explain what...
Ch. 18 - The par value of shares historically indicated the...Ch. 18 - Prob. 18.12QCh. 18 - How do we report components of comprehensive...Ch. 18 - The balance sheet reports the balances of...Ch. 18 - At times, companies issue their shares for...Ch. 18 - Prob. 18.16QCh. 18 - The costs of legal, promotional, and accounting...Ch. 18 - When a corporation acquires its own shares, those...Ch. 18 - Discuss the conceptual basis for accounting for a...Ch. 18 - The prescribed accounting treatment for stock...Ch. 18 - Brandon Components declares a 2-for-1 stock split....Ch. 18 - What is a reverse stock split? What would be the...Ch. 18 - Suppose you own 80 shares of Facebook common stock...Ch. 18 - Prob. 18.24QCh. 18 - Comprehensive income LO181 Schaeffer Corporation...Ch. 18 - Stock issued LO184 Penne Pharmaceuticals sold 8...Ch. 18 - Prob. 18.3BECh. 18 - Prob. 18.4BECh. 18 - Prob. 18.5BECh. 18 - Retirement of shares LO185 Agee Storage issued 35...Ch. 18 - Treasury stock LO185 The Jennings Group...Ch. 18 - Prob. 18.8BECh. 18 - Prob. 18.9BECh. 18 - Cash dividend LO188 Real World Financials...Ch. 18 - Effect of preferred stock on dividends LO187 The...Ch. 18 - Property dividend LO187 Adams Moving and Storage,...Ch. 18 - Stock dividend LO188 On June 13, the board of...Ch. 18 - Prob. 18.14BECh. 18 - Stock split LO188 Refer to the situation...Ch. 18 - Prob. 18.16BECh. 18 - Comprehensive income LO182 The following is from...Ch. 18 - Prob. 18.2ECh. 18 - Earnings or OCI? LO182 Indicate by letter whether...Ch. 18 - Stock issued for cash; Wright Medical Group LO184...Ch. 18 - Issuance of shares; noncash consideration LO184...Ch. 18 - Prob. 18.6ECh. 18 - Share issue costs; issuance LO184 ICOT Industries...Ch. 18 - Reporting preferred shares LO184, LO187 Ozark...Ch. 18 - Prob. 18.9ECh. 18 - Prob. 18.10ECh. 18 - Retirement of shares LO185 In 2018, Borland...Ch. 18 - Treasury stock LO185 In 2018, Western Transport...Ch. 18 - Treasury stock; weighted-average and FIFO cost ...Ch. 18 - Prob. 18.14ECh. 18 - Prob. 18.15ECh. 18 - Prob. 18.16ECh. 18 - Transact ions affecting retained earnings LO186,...Ch. 18 - Effect of cumulative, nonparticipating preferred...Ch. 18 - Stock dividend LO188 The shareholders equity of...Ch. 18 - Prob. 18.20ECh. 18 - Cash in lieu of fractional share rights LO188...Ch. 18 - Prob. 18.22ECh. 18 - Transact ions affecting retained earnings LO186...Ch. 18 - Profitability ratio LO181 Comparative balance...Ch. 18 - Prob. 18.25ECh. 18 - Various stock transactions; correction of journal...Ch. 18 - Share buybackcomparison of retirement and treasury...Ch. 18 - Reacquired sharescomparison of retired shares and...Ch. 18 - Prob. 18.4PCh. 18 - Shareholders equity transactions; statement of...Ch. 18 - Prob. 18.6PCh. 18 - Prob. 18.7PCh. 18 - Prob. 18.8PCh. 18 - Effect o f preferred stock characteristics on...Ch. 18 - Prob. 18.10PCh. 18 - Stock dividends received on investments;...Ch. 18 - Various shareholders equity topics; comprehensive ...Ch. 18 - Prob. 18.13PCh. 18 - Prob. 18.1BYPCh. 18 - Prob. 18.2BYPCh. 18 - Research Case 184 FASB codification; comprehensive...Ch. 18 - Judgment Case 185 Treasury stock; stock split;...Ch. 18 - Prob. 18.6BYPCh. 18 - Prob. 18.7BYPCh. 18 - Prob. 18.8BYPCh. 18 - Prob. 1CCTC
Knowledge Booster


Learn more about
Need a deep-dive on the concept behind this application? Look no further. Learn more about this topic, accounting and related others by exploring similar questions and additional content below.Similar questions
- AFN EQUATION Refer to problem 17-1 and assume that the company had 3 million in assets at the end of 2018. However, now assume that the company pays no dividends. Under these assumptions, what additional funds would be needed for the coming year? Why is this AFN different from the one you found in problem 17-1?arrow_forwardNineteen measures of solvency and profitability The comparative financial statements of Bettancort Inc. are as follows. The market price of Bettancort Inc. common stock was 71.25 on December 31, 2016. Bettancort Inc. Comparative Retained Earnings Statement For the Years Ended December 31, 2016 and 2015 2016 2015 Retained earnings. January 1......................................... 2,655,000 2,400,000 Add net income for year............................................. 300,000 280,000 Total............................................................... 2,955,000 2,680,000 Deduct dividends: On preferred stock................................................ 15,000 15,000 On common stock................................................. 10,000 10,000 Total........................................................... 25,000 25,000 Retained earnings. December 31..................................... 2,930,000 2,655,000 Bettancort Inc. Comparative Retained Earnings Statement For the Years Ended December 31, 2016 and 2015 2016 2015 Sales...................... 1,200,000 1,000,000 Cost of goods sold............ 500,000 475,000 Gross profit............... 700,000 525,000 Selling expenses.......... 240,000 200,000 Administrative expenses...... 180,000 150,000 Total operating expenses.. 420,000 350,000 Income from operations.. 280,000 175,000 Other income............. 166,000 225,000 446,000 400,000 Other expense (Interest)... 66,000 60,000 Income before income tax 380,000 340,000 Income tax expense....... 80,000 60,000 Net income............... 300,000 280,000 Bettancort Inc. Comparative Retained Earnings Statement For the Years Ended December 31, 2016 and 2015 Dec.31, 2016 Dec. 31, 2015 Assets Current Assets: Cash.................................... 450,000 400,000 Marketable securities.................... 300,000 260,000 Accounts receivable (net)................. 130,000 110,000 Inventories.............................. 67,000 58,000 Prepaid expenses........................ 153,000 139,000 Total current assets..................... 1,100,000 967,000 Long-term investments.................... 2,350,000 2,200,000 Property, plant and equipment (net)....... 1,320,000 1,118,000 Total assets............................... 4,770,000 4,355,000 Liabilities Current liabilities.......................... 440,000 400,000 Long-term liabilities: Mortgage note payable, 8.8%, due 2021... 100,000 0 Bonds payable, 9%, due 2017............. 1,000,000 1,000,000 Total long term liabilities............... 1,100,000 1,000,000 Total liabilities............................ 1,540,000 1,400,000 Stockholders' equity Preferred stock 0.90, 10 par.. 200,000 200,000 Common stock. 5 par..................... 100,000 100,000 Retained earnings......................... 2,930,000 2,665,000 Total stockholders equity............... 3,230,000 2,955,000 Total liabilities and stockholders' equity..... 4,770,000 4,355,000 Instructions Determine the following measures for 2016, rounding to one decimal place: 1. Working capital 2. Current ratio 3. Quick ratio 4. Accounts receivable turnover 5. Number of days' sales in receivables 6. Inventory turnover 7. Number of days' sales in inventory 8. Ratio of fixed assets to long-term liabilities 9. Ratio of liabilities to stockholders equity 10. Number of times interest charges are earned 11. Number of times preferred dividends are earned 12. Ratio of sales to assets 13. Rate earned on total assets 14. Rate earned on stockholders' equity 15. Rate earned on common stockholders' equity 16. Earnings per share on common stock 17. Price-earnings ratio 18. Dividends per share of common stock 19. Dividend yieldarrow_forwardNineteen measures of solvency and profitability The comparative financial statements of Stargel Inc. are as follows. The market price of Stargel Inc. common stock was 119.70 on December 31, 2016. Stargel Inc. Comparative Retained Earnings Statement For the Years Ended December 31, 2016 and 2015 2016 2015 Retained earnings, January 1................ 5,375,000 4,545,000 Add net income for year......................... 900,000 925,000 Total..................................... 6,275,000 5,470,000 Deduct dividends: On preferred stock............................................. 45,000 45,000 On common stock.............................................. 50,000 50,000 Total........................................................ 95,0000 95,000 Retained earnings, December 3................................... 6,180,000 5,375,000 Stargel Inc. Comparative Income Statement For the Year Ended December 31, 2016 and 2015 2016 2015 Sales..................... 10,000,000 9,400,000 Cost of goods sold......... 5,350,000 4,950,000 Gross profit............... 4,650,000 4,450,000 Selling expenses.......... 2,000,000 1,080,000 Administrative expenses... 1,500.000 1,410,000 Total operating expenses 3,500,000 3,290,000 Income from operations ... 1,150,000 1,160,000 Other income............. 150,000 140,000 1,300,000 1,300,000 Other expense (interest). 170,000 150,000 Income before income tax 1,130,000 1,150,000 Income tax expense....... 230,000 225,000 Net income............... 900,000 925,000 Stargel Inc. Comparative Income Statement For the Year Ended December 31, 2016 and 2015 Dec.31, 2016 Dec. 31, 2015 Assets Current Assets: Cash.................................... 500,000 400,000 Marketable securities.................... 1,010,000 1,000,000 Accounts receivable (net)................. 740,000 510,000 Inventories.............................. 1,190000 950,000 Prepaid expenses........................ 250,000 229,000 Total current assets..................... 3,690,000 3,089,000 Long-term investments.................... 2,350,000 2,300,000 Property, plant and equipment (net)....... 3,740,000 3,366,000 Total assets............................... 9,780,000 8,755,000 Liabilities Current liabilities.......................... 900,000 880,000 Long-term liabilities: Mortgage note payable, 8.8%, due 2021... 200,000 0 Bonds payable, 9%, due 2017............. 1,500,000 1,500,000 Total long term liabilities............... 1,700,000 1,500,000 Total liabilities............................ 2,600,000 2,380,000 Stockholders' equity Preferred stock 0.90, 10 par.. 500,000 500,000 Common stock. 5 par..................... 500,000 500,000 Retained earnings......................... 6,180,000 5,375,000 Total stockholders' equity............... 7,180,000 6,375,000 Total liabilities and stockholders' equity..... 9,780,000 8,755,000 Instructions Determine the following measures for 2016, rounding to one decimal place, except per share amounts, which should be rounded to the nearest penny: 1. Working capital 2. Current ratio 3. Quick ratio 4. Accounts receivable turnover 5. Number of days salts in receivables 6. Inventory turnover 7. Number of days sales in inventory 8. Ratio of fixed assets to long-term liabilities 9. Ratio of liabilities to .stockholders' equity 10. Number of times interest charges are earned 11. Number of times preferred dividends are earned 12. Ratio of sales to assets 13. Rate earned on total assets 14. Rate earned on stockholders' equity 15. Rate earned on common stockholders' equity 16. Earnings per share on common stock 17. Price-earnings ratio 18. Dividends per share of common stock 19. Dividend yieldarrow_forward
- Measures of liquidity, solvency and profitability The comparative financial statements of Stargel Inc. are as follows. The market price of common stock was 119.70 on December 31, 20Y2. Stargel Inc. Comparative Retained Earnings Statement For the Years Ended December 31, 20Y2 and 20Y1 20Y2 20Y1 Retained earnings, January 1............. 5,375,000 4,545,000 Net income............................. 900,000 925.000 Total................................ 6,275,000 5,470,000 Dividends: Preferred stock dividends............. 45,000 45,000 Common stock dividends............. 50,000 50,000 Total dividends.................... 95,000 95,000 Retained earnings, December 31......... 6,180,000 5,375,000 Stargel Inc. Comparative Income Statement For the Years Ended December 31, 20Y2 and 20Y1 20Y2 20Y1 Sales..................... 10,000,000 9,400,000 Cost of goods sold......... 5,350,000 4,950,000 Gross profit............... 4,650,000 4,450,000 Selling expenses.......... 2,000,000 1,880,000 Administrative expenses....... 1,500,000 1,410,000 Total operating expenses 3,500,000 3,290,000 Income from operations. 1,150.000 1,160,000 Other revenue............ 150,000 140,000 1,300,000 1,300,000 Other expense (interest).. 170,000 150,000 Income before income tax.. 1,130,000 1,150,000 Income tax expense....... 230,000 225,000 Net income............... 900,000 925,000 Stargel Inc. Comparative Balance Sheet December 31,20Y2 and 20Y1 20Y2 20Y1 Assets Current assets: Cash.......................................................... 500,000 400,000 Marketable securities........................................... 1,010,000 1,000,000 Accounts receivable (net)....................................... 740,000 510,000 Inventories.................................................... 1,190,000 950,000 Prepaid expenses.............................................. 250,000 229,000 Total current assets.......................................... 3,690,000 3,089,000 Long term investments............................................ 2,350,000 2,300,000 Property, plant, and equipment (net)............................... 3,740,000 3,366,000 Total assets....................................................... 9,780.000 8,755,000 Liabilities Current liabilities.................................................. 900,000 880,000 Long term liabilities: Mortgage note payable, 10%.................................... 200,000 0 Bonds payable, 10%............................................ 1,500,000 1,500,000 Total long term liabilities.................................... 1,700,000 1,500,000 Total liabilities.................................................... 2,600,000 2,380,000 Stockholders' Equity Preferred 0, 90 stock. 10 par...................................... 500,000 500,000 Common stock, 5 par............................................. 500,000 500,000 Retained earnings................................................. 6,180,000 5,375,000 Total stockholders' equity.......................................... 7,180,000 6,375,000 Total liabilities and stockholders' equity............................. 9,780,000 8,755,000 Instructions Determine the following measures for 20Y2, rounding to one decimal place including percentages, except for per-share amounts: 1. Working capital 2. Current ratio 3. Quick ratio 4. Accounts receivable turnover 5. Number of days sales in receivables 6. Inventory turnover 7. Number of days sales in inventory 8. Ratio of fixed assets to long-term liabilities 9. Ratio of liabilities to stockholders equity 10. Times interest earned 11. Asset turnover 12. Return on total assets 13. Return on stockholders equity- 14. Return on common stockholders equity 15. Earnings per share on common stock 16. Price-earnings ratio 17. Dividends per share of common stock 18. Dividend yieldarrow_forwardD6) Finance the stock of apsara ltd is currently trading at a price of 500 another stock reynolds ( with similar cost of equity i .e., 20%) is trading at 400 per share. If the current divident per share paid by both reynolds and apsara is the same, then what would be the reasons behind the diffrence in stock prices of both these companies. explain your answer with adequate rationalearrow_forwardQ. 16) Free Cash Inc. is expected to have free cash flow to equity next year (FCFE1) equal to $9 million as well as free cash flow to firm next year (FCFF1) equal to $12 million. The growth rate of both FCFE and FCFF is expected to be equal to 3% in perpetuity. The cost of equity for Free Cash Inc. is 18% while their after-tax cost of debt is equal to 8%. The debt-to-equity ratio (D/E) of Free Cash Inc. is equal to 1. What is the intrinsic value of Free Cash Inc.'s debt: Options - $100 million $37.50 million $16.67 million $60 millionarrow_forward
- Mf2. 12. Alpha company made sales of PKR 100 Mn in 2019 and expecting that company’s top line will increase by 10% in 2020. The management has controlled its overhead and operating expenses very well in the given year which will result in net margin of 15% . The company has 1 million outstanding shares and the management is expecting to pay 40% as cash dividend at the end of year. Based on the given data, calculate following: ● Net sales ● Net profit ● Earnings per share (EPS) ● Dividend per share 13. Refer Q12, P/E ratio is estimated to be 8 times for the year. Based on the provided data calculate the share price of the Alpha stock ?arrow_forwardA6 Valuation Using the PE Multiple Nokia Corp. recently traded at $5.29 per share. At that time, earnings per share estimates for the next 12 months were $0.28. In addition, Motorola Solutions Inc. and Ericsson had forward PE ratios of 21.37 and 2 1.67, respectively. Required a. Using Motorola Solutions and Ericsson as comparables, estimate the intrinsic value of Nokia's equity per share. b. Does the estimate in part a suggest that Nokia is undervalued or overvalued? Explain.arrow_forwardProblems 18–25 assume that a foreign company using IFRS is owned by a company using U.S. GAAP. Thus, IFRS balances must be converted to U.S. GAAP to prepare consolidated financial statements. Ignore income taxes for each problem.Mikkeli OY acquired a brand name with an indefinite life in 2015 for 40,000 markkas. At December 31, 2017, the brand name could be sold for 35,000 markkas, with zero costs to sell. Expected cash flows from the continued use of the brand are 42,000 markkas, and the present value of this amount is 34,000 markkas.a. Determine the appropriate accounting for this brand name for the year ending December 31, 2017, under (1) IFRS and (2) U.S. GAAP.b. Prepare the entry(ies) that the U.S. parent would make on the December 31, 2017, conversion worksheet to convert IFRS balances to U.S. GAAP.arrow_forward
- E10.18 (LO 5), AN Suppose the following financial data were reported by 3M Company for 2021 and 2022 (dollars in millions). 3M CompanyBalance Sheets (partial) 2022 2021 Current assets Cash and cash equivalents $ 3,040 $1,849 Accounts receivable, net 3,250 3,195 Inventories 2,639 3,013 Other current assets 1,866 1,541 Total current assets $10,795 $9,598 Current liabilities $ 4,897 $5,839 Instructions Calculate the current ratio and working capital for 3M for 2021 and 2022. Suppose that at the end of 2022, 3M management used $300 million cash to pay off $300 million of accounts payable. How would its current ratio and working capital have changed?arrow_forwardQ. 13 Before Pay Inc. (BPI) currently has an ROE of 10%, total assets of $1000 and a dividend payout ratio of 100%. BPI's beta is currently equal to 1 and they have no debt. The marginal corporate income tax rate is equal to 0%. The long-term risk free rate is currently equal to 3% and the expected stock market risk premium is equal to 7%. If BPI increase their debt-to-equity ratio to 3 with an after-tax cost of debt equal to 3% and simultaneously reduce their dividend payout ratio to 50% then BPI's new intrinsic value of equity will be equal to: a) $500 b) $250 c) $1000 d) $333arrow_forwardQ. 1 Y3K, Inc. has sales of $7425, total assets of $3,500, and a debt-equity ratio of 0.29. Assume the return on equity is 20% What is the net income? (DO NOT round intermediate calculations and round your answer to 2 decimal places, e.g., 32.16) Step 1 Given information, Sales =$6,209 Total assets=$2,825 Debt-equity ratio(D/E)=1.10 Return on equity =11% arrow_forward Step 2 Return on equity(ROE) = (Profit margin)(Total asset turnover)(Equity multiplier) = (Profit margin)(Sales / Total assets)(1 + D/E) Therefore, Profit margin = [(Return on equity)(Total assets)] / [(1 + D/E)(Sales)] =[0.11*2,825]/[( 1 + 1.1)*6,209] =310.75/13,038.9 =0.0238325 Hence, Net income = Sales *profit margin =$6,209* 0.0238 =$147.98 But I am getting an error saying this answer is complete but not entirely correct?arrow_forward
arrow_back_ios
SEE MORE QUESTIONS
arrow_forward_ios
Recommended textbooks for you
 Fundamentals of Financial Management (MindTap Cou...FinanceISBN:9781337395250Author:Eugene F. Brigham, Joel F. HoustonPublisher:Cengage Learning
 AccountingAccountingISBN:9781337272094Author:WARREN, Carl S., Reeve, James M., Duchac, Jonathan E.Publisher:Cengage Learning,
 Financial & Managerial AccountingAccountingISBN:9781285866307Author:Carl Warren, James M. Reeve, Jonathan DuchacPublisher:Cengage Learning
Fundamentals of Financial Management (MindTap Cou...
Finance
ISBN:9781337395250
Author:Eugene F. Brigham, Joel F. Houston
Publisher:Cengage Learning
Accounting
Accounting
ISBN:9781337272094
Author:WARREN, Carl S., Reeve, James M., Duchac, Jonathan E.
Publisher:Cengage Learning,
Financial & Managerial Accounting
Accounting
ISBN:9781285866307
Author:Carl Warren, James M. Reeve, Jonathan Duchac
Publisher:Cengage Learning
Financial ratio analysis; Author: The Finance Storyteller;https://www.youtube.com/watch?v=MTq7HuvoGck;License: Standard Youtube License