Financial and Managerial Accounting
7th Edition
ISBN: 9781259726705
Author: John J Wild, Ken W. Shaw, Barbara Chiappetta Fundamental Accounting Principles
Publisher: McGraw-Hill Education
expand_more
expand_more
format_list_bulleted
Videos
Textbook Question
Chapter 18, Problem 1E
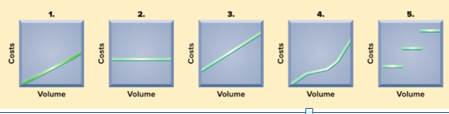
Following are five graphs representing various cost behaviors. (1) Identify whether the cost behavior in each graph is mixed, step-wise, fixed, variable, or curvilinear. (2) Identify the graph (by number) that includes the standard monthly charge plus a charge for each kilowatt hour; (d)
commissions to salespersons; and (e) costs of hourly paid workers that provide substantial gains in efficiency when a few workers are added but gradually smaller gains in efficiency when more workers are added.
______________________________________________________________________________
Expert Solution & Answer
Want to see the full answer?
Check out a sample textbook solution
Chapter 18 Solutions
Financial and Managerial Accounting
Ch. 18 - Prob. 1MCQCh. 18 - Prob. 2MCQCh. 18 - Prob. 3MCQCh. 18 - Prob. 4MCQCh. 18 - Prob. 5MCQCh. 18 - Prob. 1DQCh. 18 - Prob. 2DQCh. 18 - When output volume increases, do fixed costs per...Ch. 18 - How is the cost-volume-profit analysis useful?Ch. 18 - Prob. 5DQ
Ch. 18 - Prob. 6DQCh. 18 - Prob. 7DQCh. 18 - Prob. 8DQCh. 18 - Prob. 9DQCh. 18 - Prob. 10DQCh. 18 - Prob. 11DQCh. 18 - Prob. 12DQCh. 18 - Prob. 13DQCh. 18 - Prob. 14DQCh. 18 - Prob. 15DQCh. 18 - Prob. 16DQCh. 18 - Prob. 17DQCh. 18 - Prob. 18DQCh. 18 - Prob. 19DQCh. 18 - APPLE Should Apple use single product or...Ch. 18 - Prob. 21DQCh. 18 - Prob. 22DQCh. 18 - Prob. 1QSCh. 18 - Prob. 2QSCh. 18 - Cost behavior estimation---high-low method P1 The...Ch. 18 - Prob. 4QSCh. 18 - Prob. 5QSCh. 18 - Prob. 6QSCh. 18 - Prob. 7QSCh. 18 - Prob. 8QSCh. 18 - Prob. 9QSCh. 18 - Prob. 10QSCh. 18 - Prob. 11QSCh. 18 - Prob. 12QSCh. 18 - Prob. 13QSCh. 18 - Prob. 14QSCh. 18 - Prob. 15QSCh. 18 - Prob. 16QSCh. 18 - Prob. 17QSCh. 18 - Prob. 18QSCh. 18 - Prob. 19QSCh. 18 - Prob. 20QSCh. 18 - Prob. 21QSCh. 18 - Following are five graphs representing various...Ch. 18 - Prob. 2ECh. 18 - Prob. 3ECh. 18 - Prob. 4ECh. 18 - Prob. 5ECh. 18 - Prob. 6ECh. 18 - Prob. 7ECh. 18 - Prob. 8ECh. 18 - Prob. 9ECh. 18 - Prob. 10ECh. 18 - Prob. 11ECh. 18 - Prob. 12ECh. 18 - Prob. 13ECh. 18 - Prob. 14ECh. 18 - Prob. 15ECh. 18 - Prob. 16ECh. 18 - Prob. 17ECh. 18 - Prob. 18ECh. 18 - Prob. 19ECh. 18 - Prob. 20ECh. 18 - Prob. 21ECh. 18 - Prob. 22ECh. 18 - Prob. 23ECh. 18 - Prob. 24ECh. 18 - Prob. 25ECh. 18 - Prob. 26ECh. 18 - Prob. 27ECh. 18 - Prob. 1PSACh. 18 - Prob. 2PSACh. 18 - Prob. 3PSACh. 18 - Prob. 4PSACh. 18 - Prob. 5PSACh. 18 - Prob. 6PSACh. 18 - Prob. 7PSACh. 18 - Prob. 1PSBCh. 18 - Prob. 2PSBCh. 18 - Prob. 3PSBCh. 18 - Prob. 4PSBCh. 18 - Prob. 5PSBCh. 18 - Prob. 6PSBCh. 18 - Prob. 7PSBCh. 18 - Prob. 18SPCh. 18 - Apple offers extended service contracts that...Ch. 18 - Prob. 2BTNCh. 18 - Prob. 3BTNCh. 18 - Prob. 4BTNCh. 18 - Prob. 5BTNCh. 18 - Prob. 6BTNCh. 18 - Prob. 7BTNCh. 18 - Prob. 8BTNCh. 18 - Prob. 9BTN
Knowledge Booster


Learn more about
Need a deep-dive on the concept behind this application? Look no further. Learn more about this topic, accounting and related others by exploring similar questions and additional content below.Similar questions
- Identify cost graphs The following cost graphs illustrate various types of cost behavior: For each of the following costs, identify the cost graph that best illustrates its cost behavior as the number of units produced increases: A. Total direct materials cost B. Electricity costs of 1,000 per month plus 0.10 per kilowatt-hour C. Per-unit cost of straight-line depreciation on factory equipment D. Salary of quality control supervisor, 20,000 per month E. Per-unit direct labor costarrow_forwardBaxter Company has a relevant range of production between 15,000 and 30,000 units. The following cost data represents average variable costs per unit for 25,000 units of production. Using the costs data from Rose Company, answer the following questions: A. If 15,000 units are produced, what is the variable cost per unit? B. If 28,000 units are produced, what is the variable cost per unit? C. If 21,000 units are produced, what are the total variable costs? D. If 29,000 units are produced, what are the total variable costs? E. If 17,000 units are produced, what are the total manufacturing overhead costs incurred? F. If 23,000 units are produced, what are the total manufacturing overhead costs incurred? G. If 30,000 units are produced, what are the per unit manufacturing overhead costs incurred? H. If 15,000 units are produced, what are the per unit manufacturing overhead costs incurred?arrow_forwardMethod of Least Squares, Predicting Cost for Different Time Periods from the One Used to Develop a Cost Formula Refer to the information for Farnsworth Company on the previous page. However, assume that Tracy has used the method of least squares on the receiving data and has gotten the following results: Required: 1. Using the results from the method of least squares, prepare a cost formula for the receiving activity. 2. Using the formula from Requirement 1, what is the predicted cost of receiving for a month in which 1,450 receiving orders are processed? (Note: Round your answer to the nearest dollar.) 3. Prepare a cost formula for the receiving activity for a quarter. Based on this formula, what is the predicted cost of receiving for a quarter in which 4,650 receiving orders are anticipated? Prepare a cost formula for the receiving activity for a year. Based on this formula, what is the predicted cost of receiving for a year in which 18,000 receiving orders are anticipated?arrow_forward
- Using High-Low to Calculate Predicted Total Variable Cost and Total Cost for a Time Period That Differs from the Data Period Refer to the information for Pizza Vesuvio on the previous page. Assume that this information was used to construct the following formula for monthly labor cost. TotalLaborCost=5,237+(7.40EmployeeHours) Required: Assume that 4,000 employee hours are budgeted for the coming year. Use the total labor cost formula to make the following calculations: 1. Calculate total variable labor cost for the year. 2. Calculate total fixed labor cost for the year. 3. Calculate total labor cost for the coming year. Use the following information for Brief Exercises 3-17 through 3-20: Pizza Vesuvio makes specialty pizzas. Data for the past 8 months were collected:arrow_forwardRose Company has a relevant range of production between 10,000 and 25.000 units. The following cost data represents average cost per unit for 15,000 units of production. Using the cost data from Rose Company, answer the following questions: If 10,000 units are produced, what is the variable cost per unit? If 18,000 units are produced, what is the variable cost per unit? If 21,000 units are produced, what are the total variable costs? If 11,000 units are produced, what are the total variable costs? If 19,000 units are produced, what are the total manufacturing overhead costs incurred? If 23,000 units are produced, what are the total manufacturing overhead costs incurred? If 19,000 units are produced, what are the per unit manufacturing overhead costs incurred? If 25,000 units are produced, what are the per unit manufacturing overhead costs incurred?arrow_forwardScattergraph, High-Low Method, and Predicting Cost for a Different Time Period from the One Used to Develop a Cost Formula Refer to the information for Farnsworth Company on the previous page. Required: 1. Prepare a scattergraph based on the 10 months of data. Does the relationship appear to be linear? 2. Using the high-low method, prepare a cost formula for the receiving activity. Using this formula, what is the predicted cost of receiving for a month in which 1,450 receiving orders are processed? 3. Prepare a cost formula for the receiving activity for a quarter. Based on this formula, what is the predicted cost of receiving for a quarter in which 4,650 receiving orders are anticipated? Prepare a cost formula for the receiving activity for a year. Based on this formula, what is the predicted cost of receiving for a year in which 18,000 receiving orders are anticipated? Use the following information for Problems 3-60 and 3-61: Farnsworth Company has gathered data on its overhead activities and associated costs for the past 10 months. Tracy Heppler, a member of the controllers department, has convinced management that overhead costs can be better estimated and controlled if the fixed and variable components of each overhead activity are known. One such activity is receiving raw materials (unloading incoming goods, counting goods, and inspecting goods), which she believes is driven by the number of receiving orders. Ten months of data have been gathered for the receiving activity and are as follows:arrow_forward
- Grand Canyon Manufacturing Inc. produces and sells a product with a price of 100 per unit. The following cost data have been prepared for its estimated upper and lower limits of activity: Overhead: Selling and administrative expenses: Required: 1. Classify each cost element as either variable, fixed, or semi-variable. (Hint: Recall that variable expenses must go up in direct proportion to changes in the volume of activity.) 2. Calculate the break-even point in units and dollars. (Hint: First use the high-low method illustrated in Chapter 4 to separate costs into their fixed and variable components.) 3. Prepare a break-even chart. 4. Prepare a contribution income statement, similar in format to the statement appearing on page 540, assuming sales of 5,000 units. 5. Recompute the break-even point in units, assuming that variable costs increase by 20% and fixed costs are reduced by 50,000.arrow_forwardThe total cost for monthly supervisory cost in a factory is 4,500 regardless of how many hours the supervisor works or the quantity of output achieved. This cost a. is strictly variable. b. is strictly fixed. c. is a mixed cost. d. is a step cost. e. cannot be determined from this information.arrow_forwardUsing Regression to Calculate Fixed Cost, Calculate the Variable Rate, Construct a Cost Formula, and Determine Budgeted Cost Refer to the information for Pizza Vesuvio on the previous page. Coefficients shown by a regression program for Pizza Vesuvios data are: Required: Use the results of regression to make the following calculations: 1. Calculate the fixed cost of labor and the variable rate per employee hour. 2. Construct the cost formula for total labor cost. 3. Calculate the budgeted cost for next month, assuming that 675 employee hours are budgeted. (Note: Round answers to the nearest dollar.) Use the following information for Brief Exercises 3-17 through 3-20: Pizza Vesuvio makes specialty pizzas. Data for the past 8 months were collected:arrow_forward
- The management of Hartman Company is trying to determine the amount of each of two products to produce over the coming planning period. The following information concerns labor availability, labor utilization, and product profitability: a. Develop a linear programming model of the Hartman Company problem. Solve the model to determine the optimal production quantities of products 1 and 2. b. In computing the profit contribution per unit, management does not deduct labor costs because they are considered fixed for the upcoming planning period. However, suppose that overtime can be scheduled in some of the departments. Which departments would you recommend scheduling for overtime? How much would you be willing to pay per hour of overtime in each department? c. Suppose that 10, 6, and 8 hours of overtime may be scheduled in departments A, B, and C, respectively. The cost per hour of overtime is 18 in department A, 22.50 in department B, and 12 in department C. Formulate a linear programming model that can be used to determine the optimal production quantities if overtime is made available. What are the optimal production quantities, and what is the revised total contribution to profit? How much overtime do you recommend using in each department? What is the increase in the total contribution to profit if overtime is used?arrow_forwardPlease use the information from this problem for these calculations. After grouping cost pools and estimating overhead and activities, Box Springs determined these rates: It estimates there will be five orders in the next year, and those jobs will involve: What is the total cost of the jobs?arrow_forwardUsing the information in the previous exercises about Marleys Manufacturing, determine the operating income for department B, assuming department A sold department B 1,000 units during the month and department A reduces the selling price to the market price.arrow_forward
arrow_back_ios
SEE MORE QUESTIONS
arrow_forward_ios
Recommended textbooks for you
 Cornerstones of Cost Management (Cornerstones Ser...AccountingISBN:9781305970663Author:Don R. Hansen, Maryanne M. MowenPublisher:Cengage Learning
 Principles of Accounting Volume 2AccountingISBN:9781947172609Author:OpenStaxPublisher:OpenStax College
 Principles of Cost AccountingAccountingISBN:9781305087408Author:Edward J. Vanderbeck, Maria R. MitchellPublisher:Cengage Learning
 Managerial AccountingAccountingISBN:9781337912020Author:Carl Warren, Ph.d. Cma William B. TaylerPublisher:South-Western College Pub
 Financial And Managerial AccountingAccountingISBN:9781337902663Author:WARREN, Carl S.Publisher:Cengage Learning,
 Managerial Accounting: The Cornerstone of Busines...AccountingISBN:9781337115773Author:Maryanne M. Mowen, Don R. Hansen, Dan L. HeitgerPublisher:Cengage Learning
Cornerstones of Cost Management (Cornerstones Ser...
Accounting
ISBN:9781305970663
Author:Don R. Hansen, Maryanne M. Mowen
Publisher:Cengage Learning
Principles of Accounting Volume 2
Accounting
ISBN:9781947172609
Author:OpenStax
Publisher:OpenStax College
Principles of Cost Accounting
Accounting
ISBN:9781305087408
Author:Edward J. Vanderbeck, Maria R. Mitchell
Publisher:Cengage Learning
Managerial Accounting
Accounting
ISBN:9781337912020
Author:Carl Warren, Ph.d. Cma William B. Tayler
Publisher:South-Western College Pub
Financial And Managerial Accounting
Accounting
ISBN:9781337902663
Author:WARREN, Carl S.
Publisher:Cengage Learning,
Managerial Accounting: The Cornerstone of Busines...
Accounting
ISBN:9781337115773
Author:Maryanne M. Mowen, Don R. Hansen, Dan L. Heitger
Publisher:Cengage Learning
alue Chain Analysis EXPLAINED | B2U | Business To You; Author: Business To You;https://www.youtube.com/watch?v=SI5lYaZaUlg;License: Standard Youtube License