
Videos
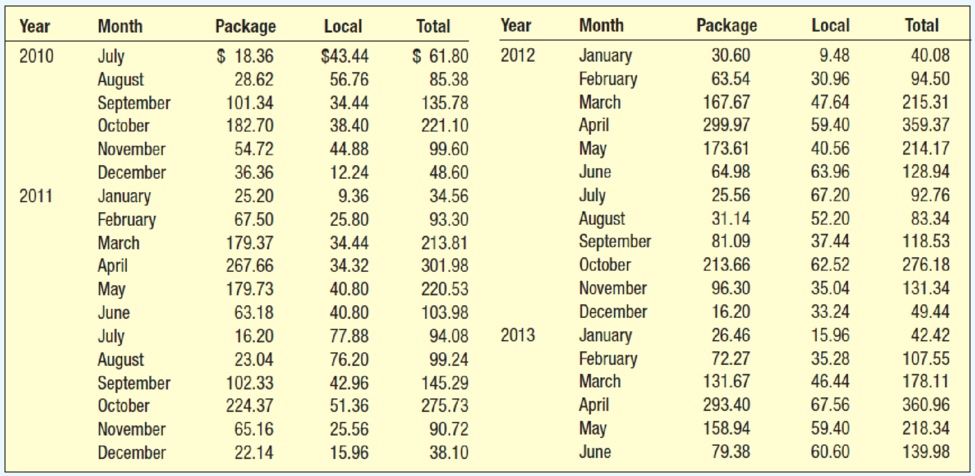
Blueberry Farms Golf and Fish Club of Hilton Head, South Carolina, wants to find monthly seasonal indexes for package play, nonpackage play, and total play. The package play refers to golfers who visit the area as part of a golf package. Typically, the greens fees, cart fees, lodging, maid service, and meals are included as part of a golfing package. The course earns a certain percentage of this total. The nonpackage play includes play by local residents and visitors to the area who wish to play golf. The following data, beginning with July 2010 and ending with June 2013, report the package and nonpackage play by month, as well as the total amount, in thousands of dollars.
 Using statistical software:
- a. Develop a seasonal index for each month for the package sales. What do you note about the various months?
- b. Develop a seasonal index for each month for the nonpackage sales. What do you note about the various months?
- c. Develop a seasonal index for each month for the total sales. What do you note about the various months?
- d. Compare the indexes for package sales, nonpackage sales, and total sales. Are the busiest months the same?
a.
Provide a seasonal index for each month for the package sales.
Write a note about the seasonal index for package sales of various months.
Answer to Problem 31CE
The seasonal indexes for each month for the package sales are given below:
| Period | Month | Seasonal Index |
| 1 | July | 0.19792 |
| 2 | August | 0.25663 |
| 3 | September | 0.8784 |
| 4 | October | 2.10481 |
| 5 | November | 0.77747 |
| 6 | December | 0.18388 |
| 7 | January | 0.26874 |
| 8 | February | 0.63189 |
| 9 | March | 1.67943 |
| 10 | April | 2.73547 |
| 11 | May | 1.67903 |
| 12 | June | 0.60633 |
The two months, October and April signify more than twice the average.
Explanation of Solution
Twelve months moving average:
Centered moving average:
Specific seasonal index:
Some preliminary calculations are given below:
| Year | Quarter | Package |
Four-quarter moving average |
Centered Moving average | Specific seasonal |
| 2010 | July | 18.36 | |||
| August | 28.62 | ||||
| September | 101.34 | ||||
| October | 182.7 | ||||
| November | 54.72 | ||||
| December | 36.36 | ||||
| 2011 | January | 25.2 | 100.305 | 0.25123 | |
| February | 67.5 | 100.395 | 99.9825 | 0.67512 | |
| March | 179.37 | 100.215 | 99.79125 | 1.79745 | |
| April | 267.66 | 99.75 | 101.5688 | 2.63526 | |
| May | 179.73 | 99.8325 | 103.74 | 1.73250 | |
| June | 63.18 | 103.305 | 103.5825 | 0.60995 | |
| July | 16.2 | 104.175 | 103.215 | 0.15695 | |
| August | 23.04 | 102.99 | 103.275 | 0.22309 | |
| September | 102.33 | 103.44 | 102.6225 | 0.99715 | |
| October | 224.37 | 103.11 | 103.4813 | 2.16822 | |
| November | 65.16 | 102.135 | 104.5725 | 0.62311 | |
| December | 22.14 | 104.8275 | 104.3925 | 0.21209 | |
| 2012 | January | 30.6 | 104.3175 | 104.8575 | 0.29183 |
| February | 63.54 | 104.4675 | 105.585 | 0.60179 | |
| March | 167.67 | 105.2475 | 105.0375 | 1.59629 | |
| April | 299.97 | 105.9225 | 103.7063 | 2.89249 | |
| May | 173.61 | 104.1525 | 104.5575 | 1.66042 | |
| June | 64.98 | 103.26 | 105.6075 | 0.61529 | |
| July | 25.56 | 105.855 | 105.1875 | 0.24299 | |
| August | 31.14 | 105.36 | 105.3788 | 0.29551 | |
| September | 81.09 | 105.015 | 104.2425 | 0.77789 | |
| October | 213.66 | 105.7425 | 102.4688 | 2.08512 | |
| November | 96.3 | 102.7425 | 101.5838 | 0.94799 | |
| December | 16.2 | 102.195 | 101.5725 | 0.15949 | |
| 2013 | January | 26.46 | 100.9725 | ||
| February | 72.27 | 102.1725 | |||
| March | 131.67 | 109.1373 | |||
| April | 293.4 | 116.937 | |||
| May | 158.94 | 120.92 | |||
| June | 79.38 | 109.3275 |
The monthly indexes are as follows:
| 2010 | 2011 | 2012 | 2013 | Means | |
| Jan | - | 0.25123 | 0.29183 | - | 0.27153 |
| Feb | - | 0.67512 | 0.60179 | - | 0.63845 |
| Mar | - | 1.79745 | 1.59629 | - | 1.69687 |
| April | - | 2.63526 | 2.89249 | - | 2.76388 |
| May | - | 1.7325 | 1.66042 | - | 1.69647 |
| June | - | 0.60995 | 0.61529 | - | 0.61262 |
| July | - | 0.15695 | 0.24299 | - | 0.19997 |
| August | - | 0.22309 | 0.29551 | - | 0.25929 |
| Sep | - | 0.99715 | 0.7778 | - | 0.88752 |
| Oct | - | 2.16822 | 2.0851 | - | 2.12667 |
| Nov | - | 0.6231 | 0.9479 | - | 0.78555 |
| Dec | - | 0.21208 | 0.1594 | - | 0.18579 |
| Total | 12.1246233 |
Seasonal index:
Here,
Therefore, the following is obtained:
The seasonal indexes are as follows:
| 2010 | 2011 | 2012 | 2013 | Means | Seasonal Index | |
| Jan | - | 0.25123 | 0.29183 | - | 0.27153 | 0.268738257 |
| Feb | - | 0.67512 | 0.60179 | - | 0.63845 | 0.631891717 |
| Mar | - | 1.79745 | 1.59629 | - | 1.69687 | 1.679428286 |
| April | - | 2.63526 | 2.89249 | - | 2.76388 | 2.735469498 |
| May | - | 1.7325 | 1.66042 | - | 1.69647 | 1.679028041 |
| June | - | 0.60995 | 0.61529 | - | 0.61262 | 0.606326037 |
| July | - | 0.15695 | 0.24299 | - | 0.19997 | 0.19791885 |
| August | - | 0.22309 | 0.29551 | - | 0.25929 | 0.256634371 |
| Sep | - | 0.99715 | 0.7778 | - | 0.88752 | 0.87840128 |
| Oct | - | 2.16822 | 2.0851 | - | 2.12667 | 2.104812143 |
| Nov | - | 0.6231 | 0.9479 | - | 0.78555 | 0.777473047 |
| Dec | - | 0.21208 | 0.1594 | - | 0.18579 | 0.183878466 |
The seasonal index for October is 2.10481 and the seasonal index for April is 2.73547. That is, the months October and April represent more than twice the average when compared to other months.
b.
Create a seasonal index for each month for the non-package sales.
Write a note on seasonal index for the non-package sales for various months.
Answer to Problem 31CE
The seasonal index for each month for the non-package sales are as follows:
| Period | Month | Seasonal Index |
| 1 | July | 1.73270 |
| 2 | August | 1.53389 |
| 3 | September | 0.94145 |
| 4 | October | 1.29183 |
| 5 | November | 0.66928 |
| 6 | December | 0.52991 |
| 7 | January | 0.23673 |
| 8 | February | 0.69732 |
| 9 | March | 1.00695 |
| 10 | April | 1.13226 |
| 11 | May | 0.98282 |
| 12 | June | 1.24486 |
The two months, December and January have the low index values.
Explanation of Solution
The specific seasonal indices are as follows:
| Year | Quarter | Local ($) |
Four-quarter moving average |
Centered Moving average | Specific seasonal |
| 2010 | July | 43.44 | |||
| August | 56.76 | ||||
| September | 34.44 | ||||
| October | 38.4 | ||||
| November | 44.88 | ||||
| December | 12.24 | ||||
| 2011 | January | 9.36 | 36.075 | 0.259459 | |
| February | 25.8 | 34.64 | 38.32 | 0.673278 | |
| March | 34.44 | 37.51 | 39.485 | 0.87223 | |
| April | 34.32 | 39.13 | 40.38 | 0.849926 | |
| May | 40.8 | 39.84 | 40.115 | 1.017076 | |
| June | 40.8 | 40.92 | 39.465 | 1.033827 | |
| July | 77.88 | 39.31 | 39.625 | 1.965426 | |
| August | 76.2 | 39.62 | 39.845 | 1.912411 | |
| September | 42.96 | 39.63 | 40.61 | 1.057868 | |
| October | 51.36 | 40.06 | 42.205 | 1.216917 | |
| November | 25.56 | 41.16 | 43.24 | 0.591119 | |
| December | 15.96 | 43.25 | 44.195 | 0.361127 | |
| 2012 | January | 9.48 | 43.23 | 44.715 | 0.212009 |
| February | 30.96 | 45.16 | 43.27 | 0.715507 | |
| March | 47.64 | 44.27 | 42.04 | 1.133206 | |
| April | 59.4 | 42.27 | 42.275 | 1.405086 | |
| May | 40.56 | 41.81 | 43.135 | 0.940304 | |
| June | 63.96 | 42.74 | 44.25 | 1.445424 | |
| July | 67.2 | 43.53 | 45.24 | 1.485411 | |
| August | 52.2 | 44.97 | 45.69 | 1.142482 | |
| September | 37.44 | 45.51 | 45.82 | 0.81711 | |
| October | 62.52 | 45.87 | 46.11 | 1.355888 | |
| November | 35.04 | 45.77 | 47.235 | 0.741823 | |
| December | 33.24 | 46.45 | 47.88 | 0.694236 | |
| 2013 | January | 15.96 | 48.02 | ||
| February | 35.28 | 47.74 | |||
| March | 46.44 | 45.97091 | |||
| April | 67.56 | 45.348 | |||
| May | 59.4 | 46.22667 | |||
| June | 60.6 | 44.19 |
The monthly indexes are as follows:
| 2010 | 2011 | 2012 | 2013 | Means | |
| Jan | - | 0.25123 | 0.29183 | - | 0.235734 |
| Feb | - | 0.67512 | 0.60179 | - | 0.694392 |
| Mar | - | 1.79745 | 1.59629 | - | 1.002718 |
| April | - | 2.63526 | 2.89249 | - | 1.127506 |
| May | - | 1.7325 | 1.66042 | - | 0.97869 |
| June | - | 0.60995 | 0.61529 | - | 1.239626 |
| July | - | 0.15695 | 0.24299 | - | 1.725419 |
| August | - | 0.22309 | 0.29551 | - | 1.527446 |
| Sep | - | 0.99715 | 0.7778 | - | 0.937489 |
| Oct | - | 2.16822 | 2.0851 | - | 1.286403 |
| Nov | - | 0.6231 | 0.9479 | - | 0.666471 |
| Dec | - | 0.21208 | 0.1594 | - | 0.527681 |
| Total | 11.94958 |
The
Therefore, the following is obtained:
The seasonal indexes are as follows:
| 2010 | 2011 | 2012 | 2013 | Means | Seasonal Index | |
| Jan | - | 0.25123 | 0.29183 | - | 0.235734 | 0.23673 |
| Feb | - | 0.67512 | 0.60179 | - | 0.694392 | 0.69732 |
| Mar | - | 1.79745 | 1.59629 | - | 1.002718 | 1.00695 |
| April | - | 2.63526 | 2.89249 | - | 1.127506 | 1.13226 |
| May | - | 1.7325 | 1.66042 | - | 0.97869 | 0.98282 |
| June | - | 0.60995 | 0.61529 | - | 1.239626 | 1.24486 |
| July | - | 0.15695 | 0.24299 | - | 1.725419 | 1.73270 |
| August | - | 0.22309 | 0.29551 | - | 1.527446 | 1.53389 |
| Sep | - | 0.99715 | 0.7778 | - | 0.937489 | 0.94145 |
| Oct | - | 2.16822 | 2.0851 | - | 1.286403 | 1.29183 |
| Nov | - | 0.6231 | 0.9479 | - | 0.666471 | 0.66928 |
| Dec | - | 0.21208 | 0.1594 | - | 0.527681 | 0.52991 |
The seasonal index for December is 0.52991 and the seasonal index for January is 0.23673. That is, the months December and January represent the less index values when compared to other months.
c.
Create a seasonal index for each month for the total sales.
Write a note on various months.
Answer to Problem 31CE
The seasonal indexes for each month for the total sales are as follows:
| Period | Month | Seasonal Index |
| 1 | July | 0.63371 |
| 2 | August | 0.61870 |
| 3 | September | 0.89655 |
| 4 | October | 1.86415 |
| 5 | November | 0.74353 |
| 6 | December | 0.29180 |
| 7 | January | 0.25908 |
| 8 | February | 0.65069 |
| 9 | March | 1.49028 |
| 10 | April | 2.28041 |
| 11 | May | 1.48235 |
| 12 | June | 0.78876 |
The two months December and January have the low index values.
The two months April and October have the high index values.
Explanation of Solution
The specific seasonal indices are as follows:
| Year | Quarter | Local ($) |
Four-quarter moving average |
Centered Moving average | Specific seasonal |
| 2010 | July | 61.8 | |||
| August | 85.38 | ||||
| September | 135.78 | ||||
| October | 221.1 | ||||
| November | 99.6 | ||||
| December | 48.6 | ||||
| 2011 | January | 34.56 | 136.38 | 0.270833 | |
| February | 93.3 | 135.035 | 138.3025 | 0.276527 | |
| March | 213.81 | 137.725 | 139.2763 | 0.161078 | |
| April | 301.98 | 138.88 | 141.9488 | 0.11365 | |
| May | 220.53 | 139.6725 | 143.855 | 0.185009 | |
| June | 103.98 | 144.225 | 143.0475 | 0.392383 | |
| July | 94.08 | 143.485 | 142.84 | 0.827806 | |
| August | 99.24 | 142.61 | 143.12 | 0.767836 | |
| September | 145.29 | 143.07 | 143.2325 | 0.295684 | |
| October | 275.73 | 143.17 | 145.6863 | 0.186269 | |
| November | 90.72 | 143.295 | 147.8125 | 0.281746 | |
| December | 38.1 | 148.0775 | 148.5875 | 0.418898 | |
| 2012 | January | 40.08 | 147.5475 | 149.5725 | 0.236527 |
| February | 94.5 | 149.6275 | 148.855 | 0.327619 | |
| March | 215.31 | 149.5175 | 147.0775 | 0.221262 | |
| April | 359.37 | 148.1925 | 145.9813 | 0.165289 | |
| May | 214.17 | 145.9625 | 147.6925 | 0.189382 | |
| June | 128.94 | 146 | 149.8575 | 0.496045 | |
| July | 92.76 | 149.385 | 150.4275 | 0.72445 | |
| August | 83.34 | 150.33 | 151.0688 | 0.62635 | |
| September | 118.53 | 150.525 | 150.0625 | 0.315869 | |
| October | 276.18 | 151.6125 | 148.5788 | 0.226374 | |
| November | 131.34 | 148.5125 | 148.8188 | 0.266788 | |
| December | 49.44 | 148.645 | 149.4525 | 0.67233 | |
| 2013 | January | 42.42 | 148.9925 | ||
| February | 107.55 | 149.9125 | |||
| March | 178.11 | 155.1082 | |||
| April | 360.96 | 162.285 | |||
| May | 218.34 | 167.1467 | |||
| June | 139.98 | 153.5175 |
The monthly indexes are given below:
| 2010 | 2011 | 2012 | 2013 | Means | |
| Jan | - | 0.25341 | 0.267964 | - | 0.260687 |
| Feb | - | 0.674608 | 0.634846 | - | 0.654727 |
| Mar | - | 1.53515 | 1.463922 | - | 1.499536 |
| April | - | 2.127388 | 2.461755 | - | 2.294571 |
| May | - | 1.533002 | 1.450107 | - | 1.491555 |
| June | - | 0.726891 | 0.860417 | - | 0.793654 |
| July | - | 0.658639 | 0.616643 | - | 0.637641 |
| August | - | 0.693404 | 0.551669 | - | 0.622537 |
| Sep | - | 1.014365 | 0.789871 | - | 0.902118 |
| Oct | - | 1.892629 | 1.858812 | - | 1.875721 |
| Nov | - | 0.613751 | 0.88255 | - | 0.74815 |
| Dec | - | 0.256415 | 0.330807 | - | 0.293611 |
| Total | 0.993829 |
The
Therefore, the following is obtained:
The seasonal indexes are given below:
| 2010 | 2011 | 2012 | 2013 | Means | Seasonal Index | |
| Jan | - | 0.25341 | 0.267964 | 0.260687 | 0.25908 | |
| Feb | - | 0.674608 | 0.634846 | 0.654727 | 0.65069 | |
| Mar | - | 1.53515 | 1.463922 | 1.499536 | 1.49028 | |
| April | - | 2.127388 | 2.461755 | 2.294571 | 2.28041 | |
| May | - | 1.533002 | 1.450107 | 1.491555 | 1.48235 | |
| June | - | 0.726891 | 0.860417 | 0.793654 | 0.78876 | |
| July | - | 0.658639 | 0.616643 | 0.637641 | 0.63371 | |
| August | - | 0.693404 | 0.551669 | 0.622537 | 0.61870 | |
| Sep | - | 1.014365 | 0.789871 | 0.902118 | 0.89655 | |
| Oct | - | 1.892629 | 1.858812 | 1.875721 | 1.86415 | |
| Nov | - | 0.613751 | 0.88255 | 0.74815 | 0.74353 | |
| Dec | - | 0.256415 | 0.330807 | 0.293611 | 0.29180 |
The seasonal index for January is 0.25908 and the seasonal index for December is 0.29180. That is, the months December and January represent the less index values when compared to other months. The seasonal index for April is 2.28041 and the seasonal index for October is 1.86415. That is, the months April and October represent the more index values when compared to other months.
d.
Compare the indexes for package sales, non-package sales, and total sales.
Explain whether the busiest months are all the same.
Explanation of Solution
The seasonal index for April in package play is large when compared to remaining months. Hence, the package play is the highest in April.
The seasonal index for July in non-package is large when compared to the remaining months. Hence, the non-package play is the highest play in July. From the given information, 70% of the total sales come from package play. Hence, the total play is very similar to package play.
Want to see more full solutions like this?
Chapter 18 Solutions
Statistical Techniques in Business and Economics, 16th Edition


 Glencoe Algebra 1, Student Edition, 9780079039897...AlgebraISBN:9780079039897Author:CarterPublisher:McGraw Hill
 Holt Mcdougal Larson Pre-algebra: Student Edition...AlgebraISBN:9780547587776Author:HOLT MCDOUGALPublisher:HOLT MCDOUGAL
 Big Ideas Math A Bridge To Success Algebra 1: Stu...AlgebraISBN:9781680331141Author:HOUGHTON MIFFLIN HARCOURTPublisher:Houghton Mifflin Harcourt