
Videos
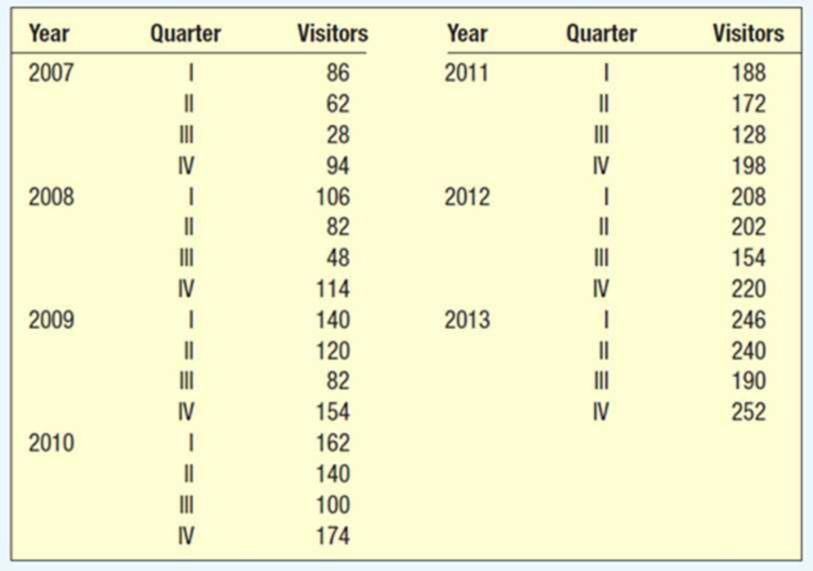
Ray Anderson, owner of Anderson Ski Lodge in upstate New York, is interested in forecasting the number of visitors for the upcoming year. The following data are available, by quarter, from the first quarter of 2007 to the fourth quarter of 2013. Develop a seasonal index for each quarter. How many visitors would you expect for each quarter of 2014, if Ray projects that there will be a 10% increase from the total number of visitors in 2013? Determine the trend equation, project the number of visitors for 2014, and seasonally adjust the forecast. Which forecast would you choose?
Obtain a seasonal index for each of the four quarters.
Find the number of visitors expected for each quarters of 2014 if there is 10% increase in the total number of visitors in 2013.
Obtain the trend equation.
Predict the number of visitors for 2014.
Find the seasonally adjusted forecasts.
Identify the best forecast.
Answer to Problem 33CE
The seasonal indexes for the four quarters are 1.2046, 1.0206, 0.6297, and 01.1451.
The number of visitors for each quarter of 2017 if there is 10% increase in the total number of visitors in 2013 is 255.25 visitors per quarter.
The trend equation is
The number of visitors for 2017 are 242.0171, 248.634, 255.2509, and 261.8678.
The seasonally adjusted forecasts are 291.5338, 253.7559, 160.7315, and 299.8648.
The best forecast is the fourth quarter of 2017.
Explanation of Solution
Four-year moving average:
Centered moving average:
Specific seasonal index:
| Year | Quarter | Visitors |
Four-quarter moving average |
Centered Moving average | Specific seasonal |
| 2007 | 1 | 86 | |||
| 2 | 62 | ||||
| 3 | 28 | 70 | 0.4 | ||
| 4 | 94 | 67.5 | 75 | 1.253333 | |
| 2008 | 1 | 106 | 72.5 | 80 | 1.325 |
| 2 | 82 | 77.5 | 85 | 0.964706 | |
| 3 | 48 | 82.5 | 91.75 | 0.523161 | |
| 4 | 114 | 87.5 | 100.75 | 1.131514 | |
| 2009 | 1 | 140 | 96 | 109.75 | 1.275626 |
| 2 | 120 | 105.5 | 119 | 1.008403 | |
| 3 | 82 | 114 | 126.75 | 0.646943 | |
| 4 | 154 | 124 | 132 | 1.166667 | |
| 2010 | 1 | 162 | 129.5 | 136.75 | 1.184644 |
| 2 | 140 | 134.5 | 141.5 | 0.989399 | |
| 3 | 100 | 139 | 147.25 | 0.679117 | |
| 4 | 174 | 144 | 154.5 | 1.126214 | |
| 2011 | 1 | 188 | 150.5 | 162 | 1.160494 |
| 2 | 172 | 158.5 | 168.5 | 1.020772 | |
| 3 | 128 | 165.5 | 174 | 0.735632 | |
| 4 | 198 | 171.5 | 180.25 | 1.098474 | |
| 2012 | 1 | 208 | 176.5 | 187.25 | 1.110814 |
| 2 | 202 | 184 | 193.25 | 1.045278 | |
| 3 | 154 | 190.5 | 200.75 | 0.767123 | |
| 4 | 220 | 196 | 210.25 | 1.046373 | |
| 2013 | 1 | 246 | 205.5 | 219.5 | 1.120729 |
| 2 | 240 | 215 | 228 | 1.052632 | |
| 3 | 190 | 224 | |||
| 4 | 252 | 232 |
The quarterly indexes are as follows:
| I | II | III | IV | |
| 2007 | 0.4 | 1.253333 | ||
| 2008 | 1.325 | 0.964706 | 0.523161 | 1.131514 |
| 2009 | 1.275626 | 1.008403 | 0.646943 | 1.166667 |
| 2010 | 1.184644 | 0.989399 | 0.679117 | 1.126214 |
| 2011 | 1.160494 | 1.020772 | 0.735632 | 1.098474 |
| 2012 | 1.110814 | 1.045278 | 0.767123 | 1.046373 |
| 2013 | 1.120729 | 1.052632 | ||
| Mean | 1.1962 | 1.0135 | 0.6253 | 1.1371 |
Seasonal index:
Here,
Therefore, the following is obtained:
The seasonal indexes are as follows:
| I | II | III | IV | |
| 2007 | 0.4 | 1.253333 | ||
| 2008 | 1.325 | 0.964706 | 0.523161 | 1.131514 |
| 2009 | 1.275626 | 1.008403 | 0.646943 | 1.166667 |
| 2010 | 1.184644 | 0.989399 | 0.679117 | 1.126214 |
| 2011 | 1.160494 | 1.020772 | 0.735632 | 1.098474 |
| 2012 | 1.110814 | 1.045278 | 0.767123 | 1.046373 |
| 2013 | 1.120729 | 1.052632 | ||
| Mean | 1.1962 | 1.0135 | 0.6253 | 1.1371 |
| Seasonal Index |
The total number of visitors in the year 2013 is
The 10% of 928 visitors is
The number of visitors in the year 2017 is
Therefore, the number of visitors in each quarter of 2017 is
Trend equation:
Step-by-step procedure to obtain the regression using the Excel:
- Enter the data for Year, Visitors and t in Excel sheet.
- Go to Data Menu.
- Click on Data Analysis.
- Select Regression and click on OK.
- Select the column of Visitors under Input Y Range.
- Select the column of t under Input X Range.
- Click on OK.
Output for the regression obtained using the Excel is as follows:
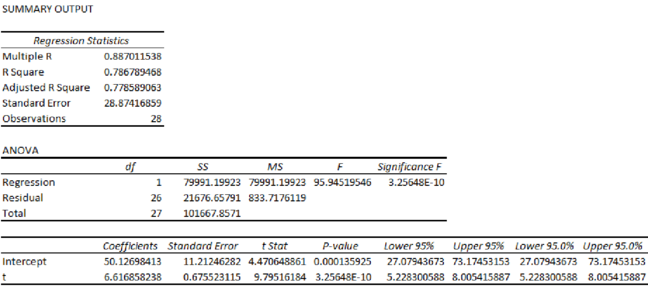
From the output, the regression equation is
Projection of the number of visitors for 2017:
The t value for the first quarter of 2014 is 29.
The t value for the second quarter of 2014 is 30.
The t value for the third quarter of 2014 is 31.
The t value for the fourth quarter of 2014 is 32.
Seasonally adjusted forecast:
| Estimated Visitors | Seasonal Index | |
| 242.0171 | 1.2046 | 291.5338 |
| 248.634 | 1.0206 | 253.7559 |
| 255.2509 | 0.6297 | 160.7315 |
| 261.8678 | 1.1451 | 299.8648 |
The seasonal index for the fourth quarter is high when compared to the remaining three quarters. Hence, the forecast for the fourth quarter is the best.
Want to see more full solutions like this?
Chapter 18 Solutions
Statistical Techniques in Business and Economics, 16th Edition


- The US. import of wine (in hectoliters) for several years is given in Table 5. Determine whether the trend appearslinear. Ifso, and assuming the trend continues, in what year will imports exceed 12,000 hectoliters?arrow_forwardTable 6 shows the year and the number ofpeople unemployed in a particular city for several years. Determine whether the trend appears linear. If so, and assuming the trend continues, in what year will the number of unemployed reach 5 people?arrow_forward
 Glencoe Algebra 1, Student Edition, 9780079039897...AlgebraISBN:9780079039897Author:CarterPublisher:McGraw Hill
 Big Ideas Math A Bridge To Success Algebra 1: Stu...AlgebraISBN:9781680331141Author:HOUGHTON MIFFLIN HARCOURTPublisher:Houghton Mifflin Harcourt