Videos
GO Samples A and B are at different initial temperatures when they are placed in a thermally insulated container and allowed to come to thermal equilibrium. Figure 18-34a gives their temperatures T versus time t. Sample A has a mass of 5.0 kg; sample B has a mass of 1.5 kg. Figure 18-34b is a general plot for the material of sample B. It shows the temperature change ΔT that the material undergoes when energy is transferred to it as heat Q. The change ΔT is plotted versus the energy Q per unit mass of the material, and the scale of the vertical axis is set by ΔTs = 4.0 C°. What is the specific heal of sample A?
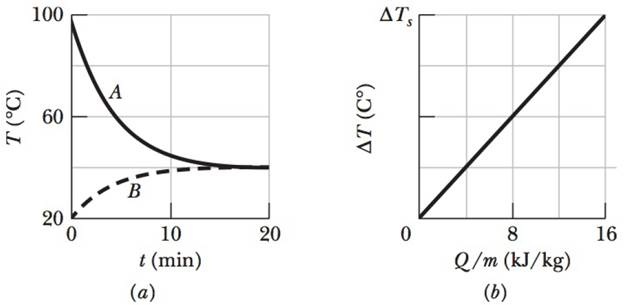
Figure 18-34 Problem 34.
Want to see the full answer?
Check out a sample textbook solution
Chapter 18 Solutions
Fundamentals of Physics, Volume 1, Chapter 1-20
Additional Science Textbook Solutions
Matter and Interactions
Conceptual Integrated Science
Essential University Physics: Volume 2 (3rd Edition)
Conceptual Physical Science (6th Edition)
Physics: Principles with Applications


- For a temperature increase of 10 at constant volume, what is the heat absorbed by (a) 3.0 mol of a dilute monatomic gas; (b) 0.50 mol of a dilute diatomic gas; and (c) 15 mol of a dilute polyatomic gas?arrow_forwardA sample of a solid substance has a mass m and a density 0 at a temperature T0. (a) Find the density of the substance if its temperature is increased by an amount T in terms of the coefficient of volume expansion b. (b) What is the mass of the sample if the temperature is raised by an amount T?arrow_forwardThe surface area of an unclothed person is 1.50 m2, and his skin temperature is 33.0C. The person is located in a dark room with a temperature of 20.0C, and the emissivity of the skin is e = 0.95. (a) At what rate is energy radiated by the body? (b) What is the significance of the sign of your answer?arrow_forward
- An aluminum rod 0.500 m in length and with a cross-sectional area of 2.50 cm2 is inserted into a thermally insulated vessel containing liquid helium at 4.20 K. The rod is initially at 300 K. (a) If one-half of the rod is inserted into the helium, how many liters of helium boil off by the time the inserted half cools to 4.20 K? Assume the upper half does not yet cool. (b) If the circular surface of the upper end of the rod is maintained at 300 K, what is the approximate boil-off rate of liquid helium in liters per second after the lower half has reached 4.20 K? (Aluminum has thermal conductivity of 3 100 W/m K at 4.20 K; ignore its temperature variation. The density of liquid helium is 125 kg/m3.)arrow_forward500 g of Ice at 0 °C is kept in an insulated cubic box. The length of the box is 30 cm and the thickness of the wall is 0.5 cm. The thermal conductivity of the wall is 0.04 W/mK. If the environment temperature outside the box is 25 °C, Determine (a) the rate of heat loss due to the heat conduction.arrow_forwardAsaparrow_forward
- The figure shows the cross section of wall made of wood of thickness La and brick of thickness Ld (=0.2 La). Two more layers are sandwiched between wood and brick with identical thickness and thermal conductivities. The thermal conductivity of the wood is ka and that of brick is kd (=5.0 ka). The face area A of the wall is unknown. Energy transfer through the wall is steady. The only known temperatures are T1 = 55oC, T2 = 30oC and T5 = -10oC. Apply the concept of steady-state heat transfer through conduction on the wall, and determine the interface temperature T4?arrow_forwardSamples A and B are at different initial temperatures when they are placed in a thermally insulated container and allowed to come to thermal equilibrium. Figure (a) gives their temperatures T versus time t. Sample A has a mass of 5.37 kg; sample B has a mass of 1.64 kg. Figure (b) is a general plot for the material of sample B. It shows the temperature change AT that the material undergoes when energy is transferred to it as heat Q. The change AT is plotted versus the energy Q per unit mass of the material, and the scale of the vertical axis is set by AT, = 4.10 °C. What is the specific heat of sample A? 100 AT A 60 20 10 20 8. 16 t (min) Q/m (kJ/kg) (a) (b) Number i Units T (°C) AT (C°)arrow_forwardIn a solar water heater, energy from the Sun is gathered by water that circulates through tubes in a rooftop collector. The solar radiation enters the collector through a transparent cover and warms the water in the tubes; this water is pumped into a holding tank. Assume that the efficiency of the overall system is 12.0% (that is, 88% of the incident solar energy is lost from the system). What collector area is necessary to raise the temperature of 450 L of water in the tank from 19°C to 36°C in 2.5 h when the intensity of incident sunlight is 480 W/m2? The specific heat of water is 4186 J/kg-K. The density of water is 1.00 g/cm. 13 Number Unitsarrow_forward
- The rectangular plate has a length of l and width of w. If the temperature increases by ΔT, find the increase of the area of the plate, given that the coefficient of the linear expansion of the plate material is α.arrow_forwardThe thermal conductivities of human tissues vary greatly. Fat and skin have conductivities of about 0.20 W/m . K and 0.020 W/m . K, respectively, while other tissues inside the body have conductivities of about 0.50 W/m . K. Assume that between the core region of the body and the skin surface lies a skin layer of 1.0 mm, fat layer of 0.50 cm, and 3.2 cm of other tissues. (a) Find the R-factor for each of these layers, and the equivalent R-factor for all layers taken together, retaining two digits. (b) Find the rate of energy loss when the core temperature is 37°C and the exterior temperature is 0°C. Assume that both a protective layer of clothing and an insulating layer of unmoving air are absent, and a body area of 2.0 m2.arrow_forwardSamples A and B are at different initial temperatures when they are placed in a thermally insulated container and allowed to come to thermal equilibrium. Figure (a) gives their temperatures T versus time t. Sample A has a mass of 4.96 kg; sample B has a mass of 1.35 kg. Figure (b) is a general plot for the material of sample B. It shows the temperature change AT that the material undergoes when energy is transferred to it as heat Q. The change AT is plotted versus the energy Q per unit mass of the material, and the scale of the vertical axis is set by AT, = 4.80 °C. What is the specific heat of sample A? 100 AT, 60 20 10 20 8. 16 t (min) Q/m (kJ/kg) (a) (b)arrow_forward
 Physics for Scientists and Engineers: Foundations...PhysicsISBN:9781133939146Author:Katz, Debora M.Publisher:Cengage Learning
 Physics for Scientists and EngineersPhysicsISBN:9781337553278Author:Raymond A. Serway, John W. JewettPublisher:Cengage Learning
 Physics for Scientists and Engineers with Modern ...PhysicsISBN:9781337553292Author:Raymond A. Serway, John W. JewettPublisher:Cengage Learning
 Principles of Physics: A Calculus-Based TextPhysicsISBN:9781133104261Author:Raymond A. Serway, John W. JewettPublisher:Cengage Learning
 College PhysicsPhysicsISBN:9781285737027Author:Raymond A. Serway, Chris VuillePublisher:Cengage Learning