Videos
Analysis Case 19–13
Analyzing financial statements; price-earnings ratio; dividend payout ratio
• LO19–13
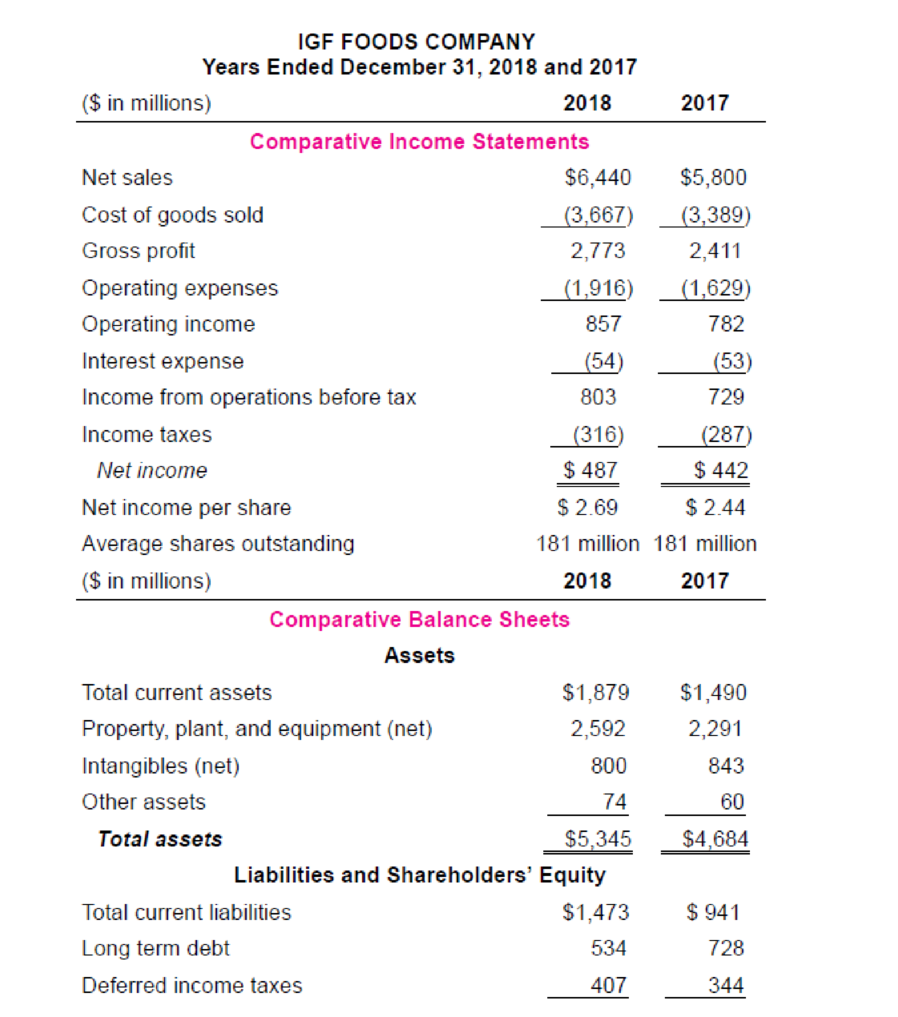
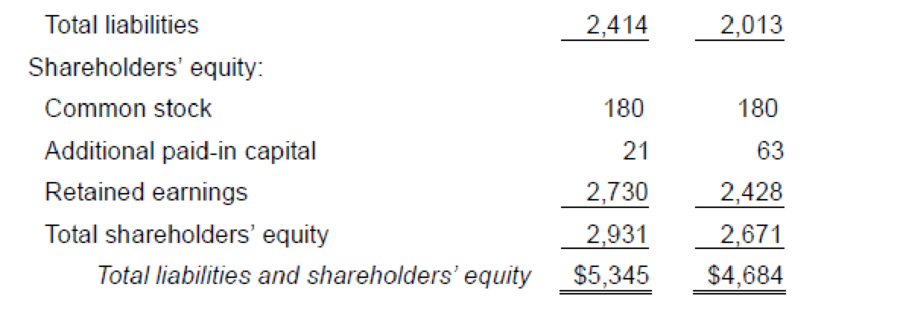
IGF Foods Company is a large, primarily domestic, consumer foods company involved in the manufacture, distribution, and sale of a variety of food products. Industry averages are derived from Troy’s The Almanac of Business and Industrial Financial Ratios and Dun and Bradstreet’s Industry Norms and Key Business Ratios. Following are the 2018 and 2017 comparative income statements and balance sheets for IGF. The market price of IGF’s common stock is $47 during 2018. (The financial data we use are from actual financial statements of a well-known corporation, but the company name used in our illustration is fictitious and the numbers and dates have been modified slightly to disguise the company’s identity.)
Some ratios express income, dividends, and market prices on a per share basis. As such, these ratios appeal primarily to common shareholders, particularly when weighing investment possibilities. These ratios focus less on the fundamental soundness of a company and more on its investment characteristics.
Required:
1. Earnings per share expresses a firm’s profitability on a per share basis. Calculate 2018 earnings per share for IGF.
2. Calculate IGF’s 2018 price-earnings ratio. The average price-earnings ratio for the stocks listed on the New York Stock Exchange in a comparable time period was 18.5. What does your calculation indicate about IGF’s earnings?
3. Calculate IGF’s 2018 dividend payout ratio. What information does the calculation provide an investor?
Want to see the full answer?
Check out a sample textbook solution
Chapter 19 Solutions
Intermediate Accounting


- Nineteen measures of solvency and profitability The comparative financial statements of Bettancort Inc. are as follows. The market price of Bettancort Inc. common stock was 71.25 on December 31, 2016. Bettancort Inc. Comparative Retained Earnings Statement For the Years Ended December 31, 2016 and 2015 2016 2015 Retained earnings. January 1......................................... 2,655,000 2,400,000 Add net income for year............................................. 300,000 280,000 Total............................................................... 2,955,000 2,680,000 Deduct dividends: On preferred stock................................................ 15,000 15,000 On common stock................................................. 10,000 10,000 Total........................................................... 25,000 25,000 Retained earnings. December 31..................................... 2,930,000 2,655,000 Bettancort Inc. Comparative Retained Earnings Statement For the Years Ended December 31, 2016 and 2015 2016 2015 Sales...................... 1,200,000 1,000,000 Cost of goods sold............ 500,000 475,000 Gross profit............... 700,000 525,000 Selling expenses.......... 240,000 200,000 Administrative expenses...... 180,000 150,000 Total operating expenses.. 420,000 350,000 Income from operations.. 280,000 175,000 Other income............. 166,000 225,000 446,000 400,000 Other expense (Interest)... 66,000 60,000 Income before income tax 380,000 340,000 Income tax expense....... 80,000 60,000 Net income............... 300,000 280,000 Bettancort Inc. Comparative Retained Earnings Statement For the Years Ended December 31, 2016 and 2015 Dec.31, 2016 Dec. 31, 2015 Assets Current Assets: Cash.................................... 450,000 400,000 Marketable securities.................... 300,000 260,000 Accounts receivable (net)................. 130,000 110,000 Inventories.............................. 67,000 58,000 Prepaid expenses........................ 153,000 139,000 Total current assets..................... 1,100,000 967,000 Long-term investments.................... 2,350,000 2,200,000 Property, plant and equipment (net)....... 1,320,000 1,118,000 Total assets............................... 4,770,000 4,355,000 Liabilities Current liabilities.......................... 440,000 400,000 Long-term liabilities: Mortgage note payable, 8.8%, due 2021... 100,000 0 Bonds payable, 9%, due 2017............. 1,000,000 1,000,000 Total long term liabilities............... 1,100,000 1,000,000 Total liabilities............................ 1,540,000 1,400,000 Stockholders' equity Preferred stock 0.90, 10 par.. 200,000 200,000 Common stock. 5 par..................... 100,000 100,000 Retained earnings......................... 2,930,000 2,665,000 Total stockholders equity............... 3,230,000 2,955,000 Total liabilities and stockholders' equity..... 4,770,000 4,355,000 Instructions Determine the following measures for 2016, rounding to one decimal place: 1. Working capital 2. Current ratio 3. Quick ratio 4. Accounts receivable turnover 5. Number of days' sales in receivables 6. Inventory turnover 7. Number of days' sales in inventory 8. Ratio of fixed assets to long-term liabilities 9. Ratio of liabilities to stockholders equity 10. Number of times interest charges are earned 11. Number of times preferred dividends are earned 12. Ratio of sales to assets 13. Rate earned on total assets 14. Rate earned on stockholders' equity 15. Rate earned on common stockholders' equity 16. Earnings per share on common stock 17. Price-earnings ratio 18. Dividends per share of common stock 19. Dividend yieldarrow_forwardNineteen measures of solvency and profitability The comparative financial statements of Stargel Inc. are as follows. The market price of Stargel Inc. common stock was 119.70 on December 31, 2016. Stargel Inc. Comparative Retained Earnings Statement For the Years Ended December 31, 2016 and 2015 2016 2015 Retained earnings, January 1................ 5,375,000 4,545,000 Add net income for year......................... 900,000 925,000 Total..................................... 6,275,000 5,470,000 Deduct dividends: On preferred stock............................................. 45,000 45,000 On common stock.............................................. 50,000 50,000 Total........................................................ 95,0000 95,000 Retained earnings, December 3................................... 6,180,000 5,375,000 Stargel Inc. Comparative Income Statement For the Year Ended December 31, 2016 and 2015 2016 2015 Sales..................... 10,000,000 9,400,000 Cost of goods sold......... 5,350,000 4,950,000 Gross profit............... 4,650,000 4,450,000 Selling expenses.......... 2,000,000 1,080,000 Administrative expenses... 1,500.000 1,410,000 Total operating expenses 3,500,000 3,290,000 Income from operations ... 1,150,000 1,160,000 Other income............. 150,000 140,000 1,300,000 1,300,000 Other expense (interest). 170,000 150,000 Income before income tax 1,130,000 1,150,000 Income tax expense....... 230,000 225,000 Net income............... 900,000 925,000 Stargel Inc. Comparative Income Statement For the Year Ended December 31, 2016 and 2015 Dec.31, 2016 Dec. 31, 2015 Assets Current Assets: Cash.................................... 500,000 400,000 Marketable securities.................... 1,010,000 1,000,000 Accounts receivable (net)................. 740,000 510,000 Inventories.............................. 1,190000 950,000 Prepaid expenses........................ 250,000 229,000 Total current assets..................... 3,690,000 3,089,000 Long-term investments.................... 2,350,000 2,300,000 Property, plant and equipment (net)....... 3,740,000 3,366,000 Total assets............................... 9,780,000 8,755,000 Liabilities Current liabilities.......................... 900,000 880,000 Long-term liabilities: Mortgage note payable, 8.8%, due 2021... 200,000 0 Bonds payable, 9%, due 2017............. 1,500,000 1,500,000 Total long term liabilities............... 1,700,000 1,500,000 Total liabilities............................ 2,600,000 2,380,000 Stockholders' equity Preferred stock 0.90, 10 par.. 500,000 500,000 Common stock. 5 par..................... 500,000 500,000 Retained earnings......................... 6,180,000 5,375,000 Total stockholders' equity............... 7,180,000 6,375,000 Total liabilities and stockholders' equity..... 9,780,000 8,755,000 Instructions Determine the following measures for 2016, rounding to one decimal place, except per share amounts, which should be rounded to the nearest penny: 1. Working capital 2. Current ratio 3. Quick ratio 4. Accounts receivable turnover 5. Number of days salts in receivables 6. Inventory turnover 7. Number of days sales in inventory 8. Ratio of fixed assets to long-term liabilities 9. Ratio of liabilities to .stockholders' equity 10. Number of times interest charges are earned 11. Number of times preferred dividends are earned 12. Ratio of sales to assets 13. Rate earned on total assets 14. Rate earned on stockholders' equity 15. Rate earned on common stockholders' equity 16. Earnings per share on common stock 17. Price-earnings ratio 18. Dividends per share of common stock 19. Dividend yieldarrow_forwardMeasures of liquidity, solvency, and profitability The comparative financial statements of Marshall Inc. are as follows. The market price of Marshall common stock was 82.60 on December 31, 20Y2. Marshall Inc. Comparative Retained Earnings Statement For the Years Ended December 31,20Y2 and 20Y1 20Y2 20Y1 Retained earnings, January 1 3,704,000 3,264,000 Net income 600,000 550,000 Total 4,304,000 3,814,000 Dividends: On preferred stock 10,000 10,000 On common stock 100,000 100,000 Total dividends 110,000 110,000 Retained earnings, December 31 4,194,000 3,704,000 Sales 10,850,000 10,000,000 Cost of goods sold 6,000,000 5,450,000 Gross profit 4,850,000 4,550,000 Selling expenses 2,170,000 2,000,000 Administrative expenses 1,627,500 1,500,000 Total operating expenses 3,797,500 3,500,000 Income from operations 1,052,500 1,050,000 Other income 99,500 20,000 1,152,000 1,070,000 Other expense (interest) 132,000 120,000 Income before income tax 1,020,000 950,000 Income tax expense 420,000 400,000 Net income 600,000 550,000 Marshall Inc. Comparative Balance Sheet December 31,20Y2 and 20Y1 20Y2 20Y1 Assets Current assets: Cash 1,050,000 950,000 Marketable securities 301,000 420,000 Accounts receivable (net) 585,000 500,000 Inventories 420,000 380,000 Prepaid expenses 108,000 20,000 Total current assets 2,464,000 2,270,000 Long-term investments 800,000 800,000 Property, plant, and equipment (net) 5,760,000 5,184,000 Total assets 9,024,000 8,254,000 Liabilities Current liabilities 880,000 800,000 Long-term liabilities: Mortgage note payable. 6% 200,000 0 Bonds payable. 4%, 3,000,000 3,000,000 Total long term liabilities 3,200,000 3,000,000 Total liabilities 4,080,000 3,800,000 Stockholders' Equity Preferred 4% stock, 5 par 250,000 250,000 Common stock. 5 par 500,000 500,000 Retained earnings 4,194,000 3,704,000 Total stockholders' equity 4,944,000 4,454,000 Total liabilities and stockholders' equity 9,024,000 8,254,000 Instructions Determine the following measures for 20Y2 (round to one decimal place, including percentages, except for per-share amounts): 1. Working capital 2. Current ratio 3. Quick ratio 4. Accounts receivable turnover 5. Number of days' sales in receivables 6. Inventory turnover 7. Number of days' sales in inventory 8. Ratio of fixed assets to long-term liabilities 9. Ratio of liabilities to stockholders' equity 10. Times interest earned 11. Asset turnover 12. Return on total assets 13. Return on stockholders' equity 14. Return on common stockholders' equity 15. Earnings per share on common stock 16. Price-earnings ratio 17. Dividends per share of common stock 18. Dividend yieldarrow_forward
- Ratio of liabilities to stockholders' equity and ratio of fixed assets to long-term liabilities Recent balance sheet information for two companies in the food industry, Mondelez International, Inc. and The Hershey Company, is as follows (in thousands): Mondelez Hershey Net property, plant, and equipment 10,010,000 1,674,071 Current liabilities 14,373,000 1,471,110 Long-term debt 15,574,000 1,530,967 Other long-term liabilities 12,816,000 716,013 Stockholders equity 32,215,000 1,036,749 A. Determine the ratio of liabilities to stockholders equity for both companies. (Round to one decimal place.) B. Determine the ratio of fixed assets to long-term liabilities for both companies. (Round to one decimal place.) C. Interpret the ratio differences between the two companies.arrow_forwardInvestment reporting O'Brien Industries Inc. is a hook publisher. The comparative unclassified balance sheets for December 31, Year 2 and Year 1 follow. Selected missing balances are shown by letters. Brien Industries Inc. Balance Sheet December 31, Year 2 and Year 1 Dec. 31, Year 2 Dec 31, Year 1 cash 233,000 220,000 Accounts receivable (net) 136,530 138,000 Available for sale investments (at cost)Note 1 a 103,770 Less valuation allowance for available-for-sale investments b. 2,500 Available for-sale investments (fair value) c 101,270 Interest receivable d Investment in Jolly Roger Co. stockNote 2 e. 77,000 Office equipment (net) 115,000 130,000 Total assets f. 666,270 Accounts payable 69.400 65,000 Common stock 70.000 70,000 Excess of issue price over par 225,000 225,000 Retained earnings g 308,770 Unrealized gain (loss) on available for-sale investments h. (2,500) Total liabilities and Stockholders equity i. 666,270 Note 1. Investments are classified as available for sale. The investments at cost and fair value on December 31, Year 1, are as follows: No. of Shares Cost per Share Total Cost Total Fair Value Bernard Co. stock 2,250 17 38,250 37,500 Chadwick Co. stock 1,260 52 65,520 63,770 103,770 101,270 Note 2. The investment in Jolly Roger Co. stock is an equity method investment representing 30% of the outstanding .shares of Jolly Roger Co. The following selected investment transactions occurred during Year 2: May 5. Purchased 3,080 shares of Gozar Inc. at 30 per share including brokerage commission. Gozar Inc. is classified as an available-for-sale security. Oct. 1. Purchased 40,000 of Nightline co. 6%, 10-Year bonds at 100. The bonds are classified as available for sale. The bonds pay interest on October 1 and April 1. 9. Dividends of 12,500 are received on the Jolly Roger co. investment. Dec. 31 Jolly Roger co. reported a total net income of 112,000 for year 2. O'Brien industries Inc. recorded equity earnings for its share of Jolly Roger co. net income. 31. Accrued three months of interest on the Nightline bonds. 31. Adjusted the available-for-sale investment portfolio to fair value, using the following fair value per-share amounts: Available-for-Sale Investments Fair Value Bernard Co. stock 15,40 per share Chadwick Co. stock 46,00 per share Gozar Inc. stock 32,00 per share Nightline Co. bonds 98 per 100 of face amount Dec. 31. Closed the OBrien Industries Inc. net income of 146,230. O'Brien Industries Inc. paid no dividends during the year. Instructions Determine the missing letters in the unclassified balance sheet. Provide appropriate supporting calculations.arrow_forwardMeasures of liquidity, solvency and profitability The comparative financial .statements of Stargel Inc. are as follows. The market price of Stargel common stock was 119.70 on December 31, 20Y2. Stargel Inc. Comparative Retained Earnings Statement For the Years Ended December 31,20Y2 and 20Y1 20Y2 20Y1 Retained earnings, January 1 5,375,000 4,545,000 Net income 900,000 925,000 Total 6,275,000 5,470,000 Dividends: On preferred stock 45,000 45,000 On common stock 50,000 50,000 Total dividends 95,000 95,000 Retained earnings, December 31 6,180,000 5,375,000 Sales 10,000,000 9,400,000 Cost of goods sold 5,350,000 4,950,000 Gross profit 4,650,000 54,450,000 Selling expenses 2,000,000 1,880,000 Administrative expenses 1,500,000 1,410,000 Total operating expenses 3,500,000 3,290,000 Income from operations 1,150,000 1,160,000 Other income 150,000 140,000 1,300,000 1,300,000 Other expense (interest) 170,000 150,000 Income before income tax 1,130,000 1,150,000 Income tax expense 230,000 225,000 Net income 900,000 925,000 Stargel Inc Comparative Balance Sheet December 31,20Y2 and 20Y1 20Y2 20Y1 Assets Current assets: 500,000 400,000 Marketable securities 1,010,000 1,000,000 Accounts receivable (net) 740,000 510,000 Inventories 1,190,000 950,000 Prepaid expenses 250,000 229,000 Total current assets 3,690,000 3,089,000 Long term investments 2,350,000 2,300,000 Property, plant, and equipment (net) 3,740,000 3,366,000 Total assets 9,780,000 8,755,000 Liabilities Current liabilities 900,000 880,000 Long term liabilities: Mortgage note payable. 10% 200,000 0 Bonds payable, 10% 1,500,000 1,500,000 Total long-term liabilities 1,700,000 1,500,000 Total liabilities 2,600,000 2,380,000 Stockholders' Equity Preferred 0.90 stock. 10 par 500,000 500,000 Common stock. 5 par 500,000 500,000 Retained earnings 6,180,000 5,375,000 Total stockholders' equity 7,180,000 6,375,000 Total liabilities and stockholders' equity 9,780,000 58,755,000 Instructions Determine the following measures for 20Y2 (round to one decimal place including percentages, except for per-share amounts): 1. Working capital 2. Current ratio 5. Quick ratio 4. Accounts receivable turnover 5. Number of days- sales in receivables 6. Inventory turnover 7. Number of days' sales in inventor) 8. Ratio of fixed assets to long-term liabilities 9. Ratio of liabilities to stockholders' equity 10. Times interest earned 11. Asset turnover 12. Return on total assets 13. Return on stockholders equity 14. Return on common stockholders' equity 15. Earnings per share on common stock 16. Price-earnings ratio 17. Dividends per share of common stock 18. Dividend yieldarrow_forward
 Corporate Financial AccountingAccountingISBN:9781305653535Author:Carl Warren, James M. Reeve, Jonathan DuchacPublisher:Cengage Learning
 AccountingAccountingISBN:9781337272094Author:WARREN, Carl S., Reeve, James M., Duchac, Jonathan E.Publisher:Cengage Learning,
 Corporate Financial AccountingAccountingISBN:9781337398169Author:Carl Warren, Jeff JonesPublisher:Cengage Learning
 Financial & Managerial AccountingAccountingISBN:9781337119207Author:Carl Warren, James M. Reeve, Jonathan DuchacPublisher:Cengage Learning
 Financial & Managerial AccountingAccountingISBN:9781285866307Author:Carl Warren, James M. Reeve, Jonathan DuchacPublisher:Cengage Learning