
Videos
Statistical quality control. Harvest Cereals produces a wide variety of breakfast products. The company’s three best-selling breakfast cereals are Double Bran Bits, Honey Wheat Squares, and Sugar King Pops. Each box of a particular type of cereal is required to meet predetermined weight specifications, so that no single box contains more or less cereal than another. The company measures the mean weight per production run to determine if there are variances over or under the company’s specified upper- and lower-level control limits. A production run that falls outside of the specified control limit does not meet quality standards and is investigated further by management to determine the cause of the variance. The three Harvest breakfast cereals had the following weight standards and production run data for the month of March:
Quality Standard: Mean Weight per Production Run
| Double Bran Bits | Honey Wheat Squares | Sugar King Pops |
| 17.97 ounces | 14 ounces | 16.02 ounces |
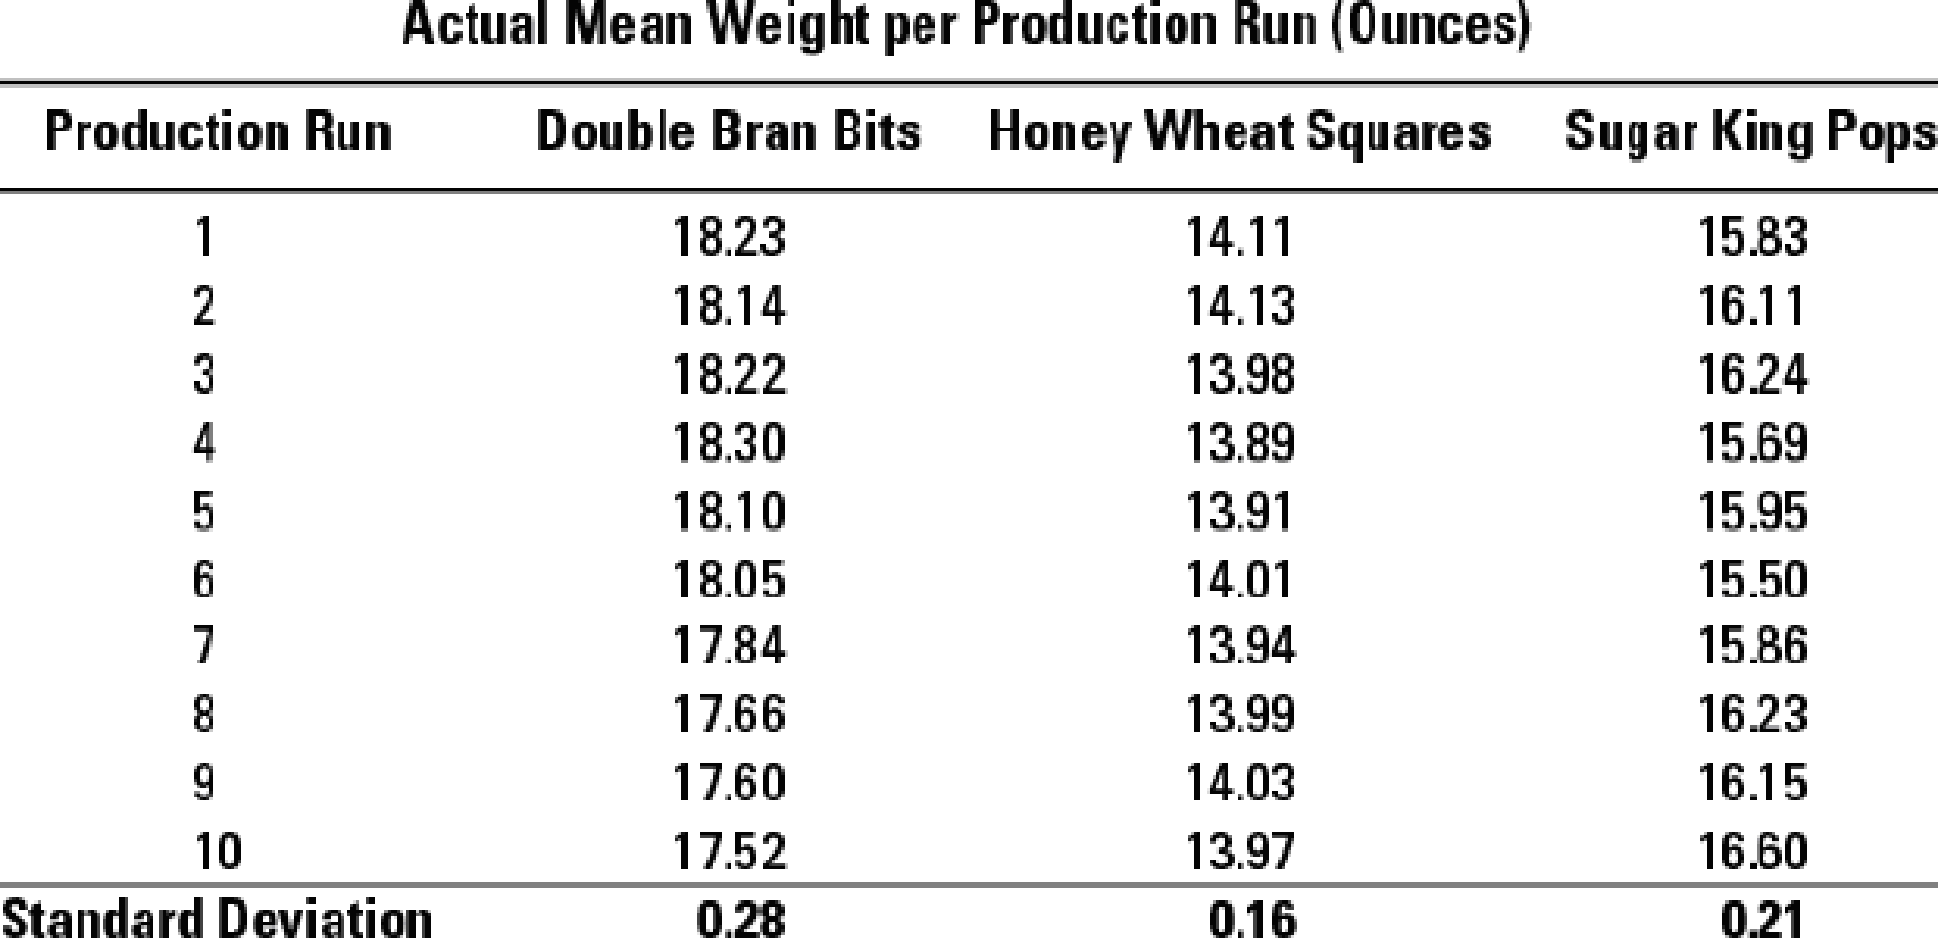
- 1. Using the ±2σ rule, what variance investigation decisions would be made?
- 2. Present control charts for each of the three breakfast cereals for March. What inferences can you draw from the charts?
- 3. What are the costs of quality in this example? How could Harvest employ Six Sigma programs to improve quality?
Want to see the full answer?
Check out a sample textbook solution
Chapter 19 Solutions
HORNGRENS COST ACCOUNTING CUSTOM FOR UC


- Solomon Fruit Basket Company makes baskets of assorted fruit. The standard and actual costs of oranges used in each basket of fruit follow. Standard Actual Average number of oranges per basket Price per orange 8.70 9.20 x $0.30 x $0.25 $2.30 Cost of oranges per basket $2.61 Solomon actually produced 26,400 baskets. Required a. Determine the materials price variance and indicate whether it is favorable (F) or unfavorable (U). b. Determine the materials usage variance and indicate whether it is favorable (F) or unfavorable (U). (For all requirements, Select "None" there is no effect (i.e., zero variance).) a. Total materials price variance b. Total materials usage variancearrow_forwardDirect materials efficiency, mix, and yield variances. Sandy’s Snacks produces snack mixes for the gourmet and natural foods market. Its most popular product is Tempting Trail Mix, a mixture of peanuts, dried cranberries, and chocolate pieces. For each batch, the budgeted quantities and budgeted prices are as follows:arrow_forwardPossible causes for price and efficiency variances. You have been invited to interview for an internship with an international food manufacturing company. When you arrive for the interview, you are given the following information related to a ctitious Belgian chocolatier for the month of June. The chocolatier manufactures truffles in 12-piece boxes. The production is labor intensive, and the delicate nature of the chocolate requires a high degree of skill.arrow_forward
- Feel soft Beauty cosmetics manufacturing company produces two products, Sunscreen and Moisturizer creams. The company gives the following information. Products Standard Quantity (Units) Standard Price ($) Actual Quantity (Units) Actual Price ($) Sunscreen 40 50 50 50 Moisturizer 60 40 60 45 Required to Calculate the following Feel soft Beauty cosmetics co. Material Price variance Material cost variance Material usage variance Explain the following variances. Sales mix variance Sales volume variance Explain the term divisional performance and explain any two common measures of divisional performance.arrow_forwardSulert, Inc., produces and sells gel-filled ice packs. Sulert’s performance report for April follows: REQUIRED: 1. Calculate the contribution margin variance and the contribution margin volume variance. 2. Calculate the market share variance and the market size variance. (CMA adapted)arrow_forwardProlife Ltd. makes Healthy Life, a nutritional aid. For a 50-pound batch, standard material and labor costs are as follows: Requirement: 1. Calculate for the material quantity, mix, and yield variances 2. Calculate for the labor mix, efficiency and yield variancesarrow_forward
- Dog Bone Bakery, which bakes dog treats, makes a special biscuit for dogs. Each biscuit uses 0.75 cup of pure semolina flour. They buy 4,000 cups of flour at $0.55 per cup. They use 3,550 cups of flour to make 4,750 biscuits. The standard cost per cup of flour is $0.53. A. What are the direct materials price variance, the direct materials quantity variances, and the total direct materials cost variance? B. What is the standard cost per biscuit for the semolina flour?arrow_forwardLettuce Turnip the Beet, Inc. is a manufacturer of blenders. Given direct material is measured in pounds, which of the following incorrectly pairs the listed variable with the appropriate label included in either the direct material variances or the direct labor variances? direct labor standard input ratio: dollar per blender actual output: blenders actual price: dollar per pound O standard rate: dollar per hour quantity purchased: poundsarrow_forwardComparative Income Statements and Sales Performance Variances; Current to PriorYear Green Grow Inc. manufactures riding lawn mowers that it sells to the large discount storessuch as Walmart, Lowe’s, and Home Depot. The mowers are marketed as a “value” product, withgood quality at a very good price. The company’s two products are the Quality mower, which lastyear sold for $1,200 (the discounters retailed it for $1,500), and the Heavy Duty model, which GreenGrow sold for $1,600 (and was retailed for $2,200). At the end of last year, the company had comeunder increased price competition from other manufacturers. The company management believes itmust reduce its price in the current year on both products to keep its current market share with salesof 3,500 units. The unit variable costs for the Quality and Heavy Duty products are $800 and $950,respectively. Management does not believe it can reduce these variable costs for the coming yearbut will begin to study ways to do so for future…arrow_forward
- izzo Goal Inc. produces and sells hockey equipment, often custom made for online orders. The company has the following performance metrics on its balanced scorecard: days from ordered to delivered, number of shipping errors, customer retention rate, nd market share. A measure map illustrates that the days from ordered to delivered and the number of shipping errors are both expected to directly affect the customer retention rate, which affects market share. Additional internal analysis finds that: Every shipping error over three shipping errors per month reduces the customer retention rate by 1.5%. On average, each day above three days from ordered to delivered yields a reduction in the customer retention rate of 1%. Each day before three days from order to delivery yields an increase in the customer retention rate of 1%, on average. Rizzo Goal Inc.'s current customer retention rate is 60%. The company estimates that for every 1% increase or decrease in the customer retention rate,…arrow_forwardRizzo Goal Inc. produces and sells hockey equipment, often custom made for online orders. The company has the following performance metrics on its balanced scorecard: days from ordered to delivered, number of shipping errors, customer retention rate, and market share. A measure map illustrates that the days from ordered to delivered and the number of shipping errors are both expected to directly affect the customer retention rate, which affects market share. Additional internal analysis finds that: Every shipping error over 2 shipping errors per month reduces the customer retention rate by 1.5%. On average, each day above 2 days from ordered to delivered yields a reduction in the customer retention rate of 1%. Each day before 2 days from order to delivery yields an increase in the customer retention rate of 1%, on average. Rizzo Goal Inc.’s current customer retention rate is 75%. The company estimates that for every 1% increase or decrease in the customer retention rate, market share…arrow_forwardRizzo Goal Inc. produces and sells hockey equipment, often custom made for online orders. The company has the following performance metrics on its balanced scorecard: days from ordered to delivered, number of shipping errors, customer retention rate, and market share. A measure map illustrates that the days from ordered to delivered and the number of shipping errors are both expected to directly affect the customer retention rate, which affects market share. Additional internal analysis finds that: Every shipping error over 3 shipping errors per month reduces the customer retention rate by 1.5%. On average, each day above 3 days from ordered to delivered yields a reduction in the customer retention rate of 1%. Each day before 3 days from order to delivery yields an increase in the customer retention rate of 1%, on average. Rizzo Goal Inc.'s current customer retention rate is 70%. ● The company estimates that for every 1% increase or decrease in the customer retention rate, market share…arrow_forward
 Cornerstones of Cost Management (Cornerstones Ser...AccountingISBN:9781305970663Author:Don R. Hansen, Maryanne M. MowenPublisher:Cengage Learning
 Managerial Accounting: The Cornerstone of Busines...AccountingISBN:9781337115773Author:Maryanne M. Mowen, Don R. Hansen, Dan L. HeitgerPublisher:Cengage Learning
 Principles of Accounting Volume 2AccountingISBN:9781947172609Author:OpenStaxPublisher:OpenStax College