Concept explainers
Videos
1.
Cost-Volume-Profit Analysis: It is a method followed to analyze the relationship between the sales, costs, and the related profit or loss at various levels of units sold. In other words, it shows the effect of the changes in the cost and the sales volume on the operating income of the company.
To prepare: an estimated income statement for 2016.
1.
Answer to Problem 19.6BPR
Prepare an estimated income statement for 2016.
| Company B | |||
| Estimated Income Statement | |||
| For the year ended December 31, 2016 | |||
| Particulars | Amount ($) | Amount ($) | Amount ($) |
| Sales (1) | 2,880,000 | ||
| Less: Cost of Goods sold: | |||
| Direct Materials (2) | 600,000 | ||
| Direct Labor (3) | 360,000 | ||
| Factory Overhead (4) | 422,000 | ||
| Cost of Goods Sold | (1,382,000) | ||
| Gross Profit | 1,498,000 | ||
| Less: Expenses: | |||
| Selling expenses: | |||
| Sales salaries and commissions (5) | 388,000 | ||
| Advertising | 116,000 | ||
| Travel | 4,000 | ||
| Miscellaneous selling expense (6) | 14,300 | ||
| Total selling expenses | 522,300 | ||
| Administrative expenses: | |||
| Office and Officers’ salaries | 325,000 | ||
| Supplies (7) | 54,000 | ||
| Miscellaneous administrative expenses (8) | 20,700 | ||
| Total administrative expenses | 399,700 | ||
| Total expenses | (922,000) | ||
| Income from operations | 576,000 | ||
Table (1)
Explanation of Solution
Working notes:
Determine sales.
Number of units to be sold =12,000 units
Selling price per unit =$240 per unit
Determine the cost of direct materials.
Number of units to be sold =12,000 units
Direct Materials cost per unit =$50 per unit
Determine the cost of direct labor.
Number of units to be sold =12,000 units
Direct labor cost per unit =$30 per unit
Determine the cost of factory overhead.
Factory overhead-Fixed =$350,000
Number of units to be sold =12,000 units
Factory overhead-Variable cost per unit =$6 per unit
Determine the sales salaries and commissions.
Sales salaries and commissions-Fixed =$340,000
Number of units to be sold =12,000 units
Sales salaries and commissions-Variable cost per unit =$4 per unit
Determine the miscellaneous selling expense.
Miscellaneous selling expense-Fixed =$2,300
Number of units to be sold =12,000 units
Miscellaneous selling expense-Variable cost per unit =$1 per unit
Determine the supplies.
Supplies-Fixed =$6,000
Number of units to be sold =12,000 units
Supplies-Variable cost per unit =$4 per unit
Determine the miscellaneous administrative expense.
Miscellaneous administrative expense-Fixed =$8,700
Number of units to be sold =12,000 units
Miscellaneous administrative expense-Variable cost per unit =$1 per unit
2.
the expected contribution margin ratio.
2.
Explanation of Solution
Determine the expected contribution margin ratio.
Sales =$2,880,000 (1)
Variable cost =$1,152,000 (9)
Working note:
Determine the variable cost.
Number of units to be sold =12,000 units
Variable cost per unit =$96 per unit
Therefore, the expected contribution margin ratio is 60%.
3.
the break-even sales in units and dollars.
3.
Explanation of Solution
Determine the break-even sales in units.
Fixed cost =$1,152,000
Contribution margin per unit =$144 per unit (10)
Working note:
Compute the contribution margin per unit.
Selling price per unit =$240 per unit
Variable cost per unit =$96 per unit
Determine the break-even sales in dollars.
Fixed cost =$1,152,000
Contribution margin ratio =60% (refer Part 2)
Therefore, the break-even sales in units is 8,000 units and dollars is $1,920,000.
4.
To construct: a cost-volume-profit chart indicating the break-even sales.
4.
Answer to Problem 19.6BPR
Construct a cost-volume-profit chart indicating the break-even sales.
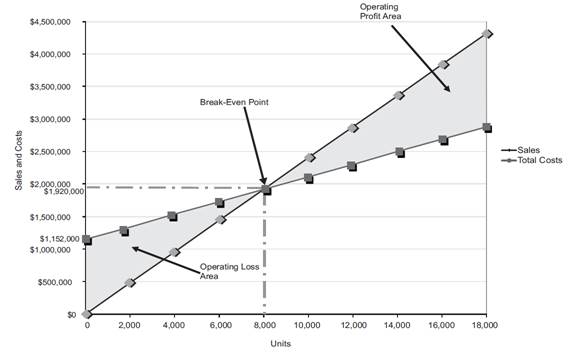
Figure (1)
Explanation of Solution
The volume in units of sales is shown on the horizontal axis. The maximum relevant range is 18,000 units. The sales and the total costs (fixed cost and variable cost) in dollars is shown on the vertical axis. The maximum relevant range of sales and total costs is $4,500,000.
The total sales line is drawn right upward by connecting the first point at $0 to the second point at $4,320,000
The total cost line is drawn right upward by connecting the first point at $1,152,000 (fixed cost) on the vertical axis to the second point at
The break-even point is the intersection point where the total sales line and total cost line meet. The vertical dotted line drawn downward from the intersection point reaches at 8,000 units. It indicates the break-even sales (units). The horizontal line drawn to the left towards the vertical axis reaches at $1,920,000. It indicates the break-even sales (dollars). Refer Part 3 for the break-even values.
The operating profit area is the area where the total sales line exceeds the total cost line. However, the operating loss area is the area where the total cost exceeds the total sales line.
5.
the expected margin of safety in dollars and as a percentage of sales.
5.
Explanation of Solution
Determine the expected margin of safety in dollars.
Sales =$2,880,000 (1)
Sales at break-even point =$1,920,000 (refer Part 3)
Determine the expected margin of safety as a percentage of sales.
Sales =$2,880,000 (1)
Margin of Safety in dollars =$960,000
Therefore, the expected margin of safety in dollars is $960,000 and as a percentage of sales is 33.3%.
6.
the operating leverage.
6.
Explanation of Solution
Determine the operating leverage.
Contribution margin =$1,728,000 (11)
Income from operations =$576,000 (refer Table 1)
Working note:
Determine the contribution margin
Sales =$2,880,000 (1)
Variable cost =$1,152,000 (9)
Therefore, the operating leverage is 3.
Want to see more full solutions like this?
Chapter 19 Solutions
Financial & Managerial Accounting


- Contribution margin, break-even sales, cost-volume-profit chart, margin of safety, and operating leverage Belmain Co. expects to maintain the same inventories at the end of 20Y7 as at the beginning of the year. The total of all production costs for the year is therefore assumed to be equal to the cost of goods sold. With this in mind, the various department heads were asked to submit estimates of the costs for their departments during the year. A summary report of these estimates is as follows: It is expected that 12,000 units will be sold at a price of 240 a unit. Maximum sales within the relevant range are 18,000 units. Instructions 1. Prepare an estimated income statement for 20Y7. 2. What is the expected contribution margin ratio? 3. Determine the break-even sales in units and dollars. 4. Construct a cost-volume-profit chart indicating the break-even sales. 5. What is the expected margin of safety in dollars and as a percentage of sales? (Round to one decimal place.) 6. Determine the operating leverage.arrow_forwardCost-Volume-Profit, Margin of Safety Victoria Company produces a single product. Last years income statement is as follows: Required: 1. Compute the break-even point in units and sales dollars calculated using the break-even units. 2. What was the margin of safety for Victoria last year in sales dollars? 3. Suppose that Victoria is considering an investment in new technology that will increase fixed cost by 250,000 per year but will lower variable costs to 45% of sales. Units sold will remain unchanged. Prepare a budgeted income statement assuming that Victoria makes this investment. What is the new break-even point in sales dollars, assuming that the investment is made?arrow_forwardSales Revenue Approach, Variable Cost Ratio, Contribution Margin Ratio Arberg Companys controller prepared the following budgeted income statement for the coming year: Required: 1. What is Arbergs variable cost ratio? What is its contribution margin ratio? 2. Suppose Arbergs actual revenues are 30,000 more than budgeted. By how much will operating income increase? Give the answer without preparing a new income statement 3. How much sales revenue must Arberg earn to break even? Prepare a contribution margin income statement to verify the accuracy of your answer. 4. What is Arbergs expected margin of safety? 5. What is Arbergs margin of safety if sales revenue is 380,000?arrow_forward
- Income Statements under Absorption and Variable Costing In the coming year, Kalling Company expects to sell 28,700 units at 32 each. Kallings controller provided the following information for the coming year: Required: 1. Calculate the cost of one unit of product under absorption costing. 2. Calculate the cost of one unit of product under variable costing. 3. Calculate operating income under absorption costing for next year. 4. Calculate operating income under variable costing for next year.arrow_forwardUsing the information in the previous exercises about Marleys Manufacturing, determine the operating income for department B, assuming department A sold department B 1,000 units during the month and department A reduces the selling price to the market price.arrow_forwardForchen, Inc., provided the following information for two of its divisions for last year: Required: 1. For the Small Appliances Division, calculate: a. Average operating assets b. Margin c. Turnover d. Return on investment (ROI) 2. For the Cleaning Products Division, calculate: a. Average operating assets b. Margin c. Turnover d. Return on investment (ROI) 3. What if operating income for the Small Appliances Division was 2,000,000? How would that affect average operating assets? Margin? Turnover? ROI? Calculate any changed ratios (round to four significant digits).arrow_forward
- Quality Cost Report Loring Company had total sales of 2,400,000 for fiscal 20X1. The costs of quality-related activities are given below. Required: 1. Prepare a quality cost report, classifying costs by category and expressing each category as a percentage of sales. What message does the cost report provide? 2. Prepare a bar graph and pie chart that illustrate each categorys contribution to total quality costs. Comment on the significance of the distribution.arrow_forwardWellington, Inc., reports the following contribution margin income statement for the month of May. The company has the opportunity to purchase new machinery that will reduce its variable cost per unit by $10 but will increase fixed costs by 20%. Prepare a projected contribution margin income statement for Wellington, Inc., assuming it purchases the new equipment. Assume sales level remains unchanged.arrow_forwardMerkley Company, a manufacturer of machine parts, implemented lean manufacturing at the end of 20X1. Three value streams were established: one for new product development and two order fulfillment value streams. One of the value streams set a goal to increase its ROS to 45% of sales by the end of the year. During the year, the value stream made significant improvements in several areas. The Box Scorecard below was prepared, with performance measures for the beginning of the year, midyear, and end of year. Although the members of the value stream were pleased with their progress, they were disappointed in the financial results. They were still far from the targeted ROS of 45%. They were also puzzled as to why the improvements made did not translate into significantly improved financial performance. Required: 1. From the scorecard, what was the focus of the value-stream team for the first 6 months? The second 6 months? What are the implications of these changes? 2. Using information from the scorecard, offer an explanation for why the financial results were not as good as expected.arrow_forward
 Managerial AccountingAccountingISBN:9781337912020Author:Carl Warren, Ph.d. Cma William B. TaylerPublisher:South-Western College Pub
 Managerial Accounting: The Cornerstone of Busines...AccountingISBN:9781337115773Author:Maryanne M. Mowen, Don R. Hansen, Dan L. HeitgerPublisher:Cengage Learning
 Survey of Accounting (Accounting I)AccountingISBN:9781305961883Author:Carl WarrenPublisher:Cengage Learning
 Financial And Managerial AccountingAccountingISBN:9781337902663Author:WARREN, Carl S.Publisher:Cengage Learning,
 Cornerstones of Cost Management (Cornerstones Ser...AccountingISBN:9781305970663Author:Don R. Hansen, Maryanne M. MowenPublisher:Cengage Learning
 Principles of Accounting Volume 2AccountingISBN:9781947172609Author:OpenStaxPublisher:OpenStax College