
Videos
After numerous experiments with a circuit configuration, you determined that as long as the transistor chosen meets certain criteria, other components in the circuit can be adjusted to yield an ideal frequency response. In the classification diagram shown, there are two regions where the transistor is acceptable.
Zone A, shown in solid magenta lines, is defined as:
- a horizontal line at 7500 Hz for voltages from 0 to 3 V;
- a linear line from (3, 7500) to (6, 9000);
- A vertical line at 6 V for a frequency from 6000 to 9000 Hz; and
- a power law curve which extends from (0, 0) to (6, 6000), passing through the point (3, 4244).
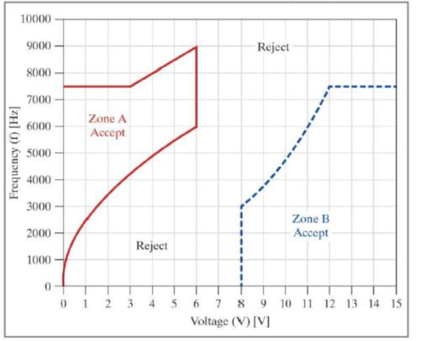
Zone B, shown n blue, dotted line segments, defined as
- a horizontal lire at 7500 Hz for voltages horn 12 to 15 V;
- a vertical line at 8 V for a frequency from 0 to 3000 Hz; and
- an exponential curve which extends from (8, 3000), to (12, 7500), passing through the point (11, 6000).
If a point fails on a line dividing the Accept and Reject regions, it is considered acceptable. Create the classification diagram, duplicating the diagram exactly as shown.
The user will be asked if they wish to enter a set of test values using a menu choice of Yes or No. If the user selects Yes, they will be allowed to specify a pair of experimental test values for a specific transistor and store the response in the two-element
As long as the user enters a two-element row vector and values are within the correct ranges, the program will follow these steps:
- The program will determine if the V. f pair entered by the user is Accepted or Rejected:
- If the test value lies in an Accept region, the program will save in the cell array the text Accept Device in Zone # in a variable where # is replaced by the letter A or B depending on the Zone the point lies in.
- If the test value in anywhere outside an Accept region, the program will save in the cell array the test Reject Device.
- The program should also keep track, as running totals, of the number of points that have been accepted and the number rejected.
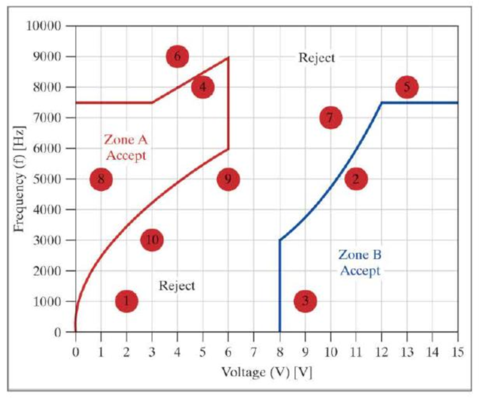
- The point is added to the classification diagram as a size 20 red, solid circle. The center of the circle should contain the point number entered by the user (1 for first point, 2 for second point, etc.)
- The user is then prompted by the menu to select if they wish to enter another pair of test values.
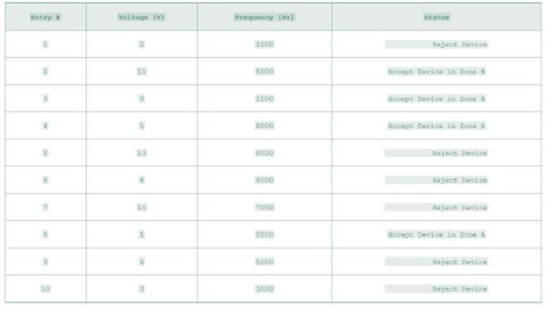
- If the user selects No from the menu or closes the menu at any time the program will end the input loop and show the results in the Command Window. If the user has entered at least one valid rosy vector and then enters a voltage value outside the acceptable range of 0 to 15 volts, the program will print the results in tabular format, similar to the following table. It will also report the number of points accepted and number of points rejected that were entered by the user.
Example showing tabular output to Command Window and the graph created
Your teats resulted in:
4Accepted Devices
6 Rejected Devices
Want to see the full answer?
Check out a sample textbook solution
Chapter 19 Solutions
Thinking Like an Engineer: An Active Learning Approach (4th Edition)


- PLEASE ANSWER THEM ALL FOR AN UPVOTE. THANK YOU. Given: Pi constant to be used: 3.14159 Capillary tube: radius = 0.02 cm; length = 9 cm; pressure = 0.7 mmHg Liquid sample: density = 4 ml; time of flow = 4.5 seconds Ans. the ff questions. •What is the pressure in MKS unit? •What is the pressure in CGS unit? •What is the viscosity of the liquid? • If the weight was given as 8.5 grams, what will be the density of the liquid? •What is the kinematic viscosity of the liquid? •What is the fluidity of the liquid?arrow_forwardThe Ideal gas law shows the relationship between some common properties of ideal gases and is written as PV = nRT. P = pressure, V = volume, n = number of moles of ideal Gas, R = General gas constant = 8.314 kJ/(kmol.K) and T = absolute temperature. 5 mol ideal gas at 22°C is placed in a cube with edge lengths of 0.750 meters. Calculate the pressure of the Ideal gas as [Pa].arrow_forward2. (If relevant) A clearly labeled diagram (or diagrams) clearly pertaining to your analysis with a coordinate system and relevant labels. Final answer with appropriate units and significant figures. You can use the fprintf() command in MATLAB to format numerical results A 2-3 sentence reflection on your answer. Does it make sense? Why or why not? What are some implications?arrow_forward
- In the movie Back to the Future, Marty travels back in time to 1955. In 1955, the only available light bulbs in the United States were incandescent bulbs. Assume that last year, you traveled back in time to 1955 and changed all the light bulbs in a single average American household (45 light bulbs) from 75-watt incandescent bulbs to the corresponding 17-watt LED bulbs. The estimated usage is 3 hours per day , at a cost of $0.11 per kilowatt-hour . Based on energy cost alone - not considering the cost to replace any light bulbs and not considering any changes in energy cost with time - how much money in dollars would this household have saved over a 66-year time span (from 1955 to 2021) by changing from incandescent to LED bulbs?arrow_forwardEngr 215 Matlab Fahrenheit to Celsius using multiple statements Given a Fahrenheit value temperatureFahrenheit, write a statement that assigns temperatureCelsius with the equivalent Celsius value. While the equation is C = 5/9 * (F - 32), as an exercise use two statements, the first of which is "fractionalMultiplier = 5/9;"]arrow_forwardHi, The answer is suppose to be 4.36 KN. The picture attached is a hint to the answer according to my professor.arrow_forward
- Mean radiant temperature sketch for calculations Using the sketch above, calculate the MRT for Person B, if the temperature on the exterior glass wall is 14 o C, the temperature on the solid exterior wall is 17 o C and the temperature on the interior walls is 22 o C . Round to one decimal place at your answer only.arrow_forwardThe title of our study is "Design and Fabrication of an Agricultural Spraying Attachment for an Autonomous Rover" we need help in the machine design part of our study, specifically Pump selection, battery selection, and center of gravity computation I already sent you the image of the rover Rover weight capacity 35 kilo grams (payload) Rover measurements: Wheel distance - 14.5 inches and 8.5 inches Rover platform size (width & length) 14.4 inches x 10.4 inches Height- 15.8 inches. Water tank selection More or less 25 liters *For tank selection we need to justify the size with the center of gravity, proving that is the maximum dimension or liters of the tank because the center of gravity will be higher making the rover prone to toppling Pump selection *Our sprayer design has two nozzles which splits using a tee splitter, we need to find the size of the pump to obtain the same discharge rate of a normal sprayer. A normal sprayer has a 12V pump and a pressure from 0.2 to 0.45 mpa…arrow_forward
 Elements Of ElectromagneticsMechanical EngineeringISBN:9780190698614Author:Sadiku, Matthew N. O.Publisher:Oxford University Press
 Mechanics of Materials (10th Edition)Mechanical EngineeringISBN:9780134319650Author:Russell C. HibbelerPublisher:PEARSON
 Thermodynamics: An Engineering ApproachMechanical EngineeringISBN:9781259822674Author:Yunus A. Cengel Dr., Michael A. BolesPublisher:McGraw-Hill Education
 Control Systems EngineeringMechanical EngineeringISBN:9781118170519Author:Norman S. NisePublisher:WILEY
 Mechanics of Materials (MindTap Course List)Mechanical EngineeringISBN:9781337093347Author:Barry J. Goodno, James M. GerePublisher:Cengage Learning
 Engineering Mechanics: StaticsMechanical EngineeringISBN:9781118807330Author:James L. Meriam, L. G. Kraige, J. N. BoltonPublisher:WILEY