
Principles Of Economics V8.0
18th Edition
ISBN: 9781453384503
Author: Taylor, John B.; Weerapana, Akila
Publisher: BOSTON ACADEMIC (DBA FLAT WORLD)
expand_more
expand_more
format_list_bulleted
Textbook Question
Chapter 19, Problem 4SCQ
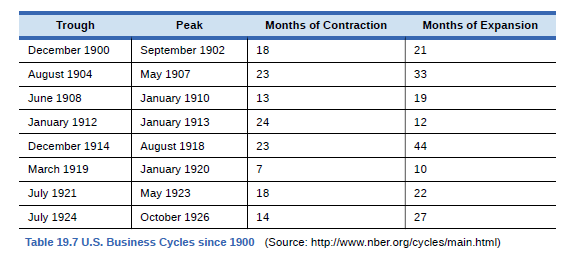
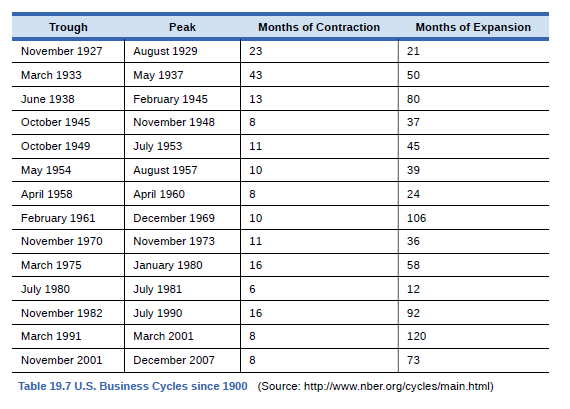
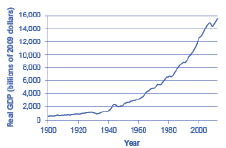
Without looking at Table 19.7, return to Figure 19.10. If we define a recession as a significant decline in national output, can you identify any post-1960 recessions in addition to the

Expert Solution & Answer
Want to see the full answer?
Check out a sample textbook solution
Students have asked these similar questions
What common rule of thumb do economists use to define a recession?
A decline of 5% in GDP
A decline of 10% in GDP
One quarter of negative GDP growth
Two quarters (six months)of negative GDP growth
The graph below is associated with a hypothetical country. Consider a decrease in aggregate demand (AD). Specifically, aggregate demand shifts to
the left from AD₁ to AD2, causing the quantity of output demanded to fall at each price level. For instance, at a price level of 140, output is now
$200 billion, where initially it was $300 billion.
PRICE LEVEL
170
160
150
140
130
120
110
100
90
0
100
+-+
I I
200 300 400 500
OUTPUT (Billions of dollars)
AD1
AD2
600
700
800
?
The following graph shows an increase in aggregate demand (AD) in a hypothetical country. Specifically, aggregate demand shifts to the right from
AD1 to AD2, causing the quantity of output demanded to rise at all price levels. For example, at a price level of 140, output is now $400 billion,
where previously it was $300 billion.
170
160
150
140
-
130
AD2
120
110
AD,
100
90
100
200
300
400
500
600
700
800
OUTPUT (Billions of dollars)
The following table lists several determinants of aggregate demand.
Complete the table by indicating the change in each determinant necessary to increase aggregate demand.
Change Needed to Increase AD
Wealth
Taxes
Interest rates
The value of the domestic currency relative to the foreign currency
PRICE LEVEL
Chapter 19 Solutions
Principles Of Economics V8.0
Ch. 19 - Country A has export sales of 20 billion,...Ch. 19 - Which of the following are included in GDP, and...Ch. 19 - Using data from Table 19.5 how much of the nominal...Ch. 19 - Without looking at Table 19.7, return to Figure...Ch. 19 - According to Table 19.7, how often have recessions...Ch. 19 - According to Table 19.7, how long has the average...Ch. 19 - According to Table 19.7, how long has the average...Ch. 19 - Is it possible for GDP to rise while at the same...Ch. 19 - The Central African Republic has a GDP of...Ch. 19 - Explain briefly whether each of the following...
Ch. 19 - What are the main components of measuring GDP with...Ch. 19 - What are the main components of measuring GDP with...Ch. 19 - Would you usually expect GDP as measured by what...Ch. 19 - Why must you avoid double counting when measuring...Ch. 19 - What is the difference between a series of...Ch. 19 - How do you convert a series of nominal economic...Ch. 19 - What are typical GDP patterns for a high-income...Ch. 19 - What are the two main difficulties that arise in...Ch. 19 - List some of the reasons why economists should not...Ch. 19 - U.S. macroeconomic data are among the best in the...Ch. 19 - What does GDP not tell us about the economy?Ch. 19 - Should people typically pay more attention to...Ch. 19 - Why do you suppose that U.S. GDP is so much higher...Ch. 19 - Why do you think that GDP does not grow at a...Ch. 19 - Cross country comparisons of GDP per capita...Ch. 19 - Why might per capita GDP be only an imperfect...Ch. 19 - How might you measure a green GDP?Ch. 19 - Last year, a small nation with abundant forests...Ch. 19 - The prime interest rate is the rate that banks...Ch. 19 - A mortgage 105m is a loan that a person makes to...Ch. 19 - Ethiopia has a GDP of 8 billion (measured in U.S....Ch. 19 - In 1980, Denmark had a GDP of 70 billion (measured...Ch. 19 - The Czech Republic has 3 GDP of 1,800 billion...
Additional Business Textbook Solutions
Find more solutions based on key concepts
Journal entries, T-accounts, and source documents. Visual Company produces gadgets for the coveted small applia...
Horngren's Cost Accounting: A Managerial Emphasis (16th Edition)
Prepare a production cost report and journal entries (Learning Objectives 4 5) Vintage Accessories manufacture...
Managerial Accounting (5th Edition)
E2-13 Identifying increases and decreases in accounts and normal balances
Learning Objective 2
Insert the mis...
Horngren's Accounting (12th Edition)
Which of these accounts would be present in the closing entries? A. Dividends B. Accounts Receivable C. Unearne...
Principles of Accounting Volume 1
Discussion Questions 1. What characteristics of the product or manufacturing process would lead a company to us...
Managerial Accounting (4th Edition)
Ravenna Candles recently purchased candleholders for resale in its shops. Which of the following costs would be...
Financial Accounting (12th Edition) (What's New in Accounting)
Knowledge Booster

Similar questions
- The government of Australia has embarked on various policies in order to reduce the severity of COVID 19 on the economy. Has COVID 19 caused economic expansion or a recession? Explain your answer using at least two economic effects on the economy of Australiaarrow_forwardWhen a recession begins and ends is determined by the Business Cycle Dating Committee (chaired by our textbook author Robert Hall) within the National Bureau of Economic Research (NBER). The NBER concluded that the unprecedented magnitude of the decline in employment and production, and its broad reach across the entire economy, warrants the designation of this current pandemic-driven episode in the nation as a recession. True Falsearrow_forwardFrom 1/1/2020 to 7/1/2020, real GDP decreased but the GDP deflator stayed approximately the same (thus, treat it as the same number at the beginning of this period as it was at the end of this period). According to our aggregate supply/demand analysis, which of the following must have occurred over this time frame? (Use the graph to help you see if you can determine any shift(s).) Group of answer choices a) increase in Aggregate Demand, decrease in Aggregate Supply b) decrease in Aggregate Demand, decrease in Aggregate Supply c) increase in Aggregate Demand, increase in Aggregate Supply d) increase in Aggregate Demand, but no way to determine the direction of shift in Aggregate Supply e) decrease in Aggregate Demand, increase in Aggregate Supplyarrow_forward
- Consider the following two alternative definitions of a recession: 1.A period of negative output growth. 2.A period when the output level is below the country's potential, or normal, level. Now consider a country that has been producing a lot of oil, whose oil wells have suddenly run out. This results in both its potential, and actual, output falling. Which of the following statements are correct? The policymaker using the second definition may underreact to the slowing output. The policymaker using the first definition may underreact to the slowing output. O According to the first definition, the country is now unambiguously in a recession. O According to the second definition, the country is now unambiguously in a recession.arrow_forwardThe graph below is associated with a hypothetical country. Consider a decrease in aggregate demand (AD). Specifically, aggregate demand shifts to the left from AD to AD₂, causing the quantity of output demanded to fall at each price level. For instance, at a price level of 140, output is now $200 billion, where initially it was $300 billion. PRICE LEVEL 170 160 150 140 130 120 110 100 8 90 0 100 AD₁ AD₂ 200 300 400 500 600 OUTPUT (Billions of dollars): 700 800 ?arrow_forwardWhich of the following quarterly real GDP scenarios would be considered a recession? Scenario A: Q1 GDP 5.4 Billion, Q2 GDP 5.6 Billion, Q3 GDP 5.4 Billion, Q4 GDP 5.2 Billion Scenario B: Q1 GDP 5.4 Billion, Q2 GDP 5.2 Billion, Q3 GDP 5.4 Billion, Q4 GDP 5.5 Billion Scenario C: Q1 GDP 5.4 Billion, Q2 GDP 5.1 Billion, Q3 GDP 5.7 Billion, Q4 GDP 5.2 Billionarrow_forward
- (Note: All your answers should be rounded to the nearest hundredth. Example: 12.034 =>12.03, 5.175=>5.18) For each of the following situations, use an AD/AS model to describe what happens to price levels and output in the United States in the short run. In each case assume the economy starts in long- and short-run equilibrium, and show the appropriate shifts in the AS or AD curves. Suppose that the AD and AS curves are given as: AD: AS: P=6.1-0.2 Y(GDP) P= -1 +0.15 Y(GDP) Using Excel create a spreadsheet with the column headings Y, AD,JAS, G, and T. Let's start with no change in G, and T. Fill in the spreadsheet's cells for Y= 19.0 to Y= 21.0 in increments of 0.1. What is the equilibrium GDP? What is the equilibrium P? Now, there is a decrease in Tax (T), i.e., tax cut by $1 (trillion). It is assumed that an 1 unit decrease in T shifts the AD curve to the right by 0.08 units. If P and Y (GDP) won't change immediately, what happens to the nation's output? (surplus, shortage, or no…arrow_forwardPlease draw four AD/AS diagrams (t-0,1,2,3) to show how the Covid-19 pandemic has affected our economy as economic shocks (without any government intervention) in short-run and long-run. Please show the adjustment process in one of your diagrams. Please write a short explanation for each diagram that you draw.arrow_forwardSuppose you are given the following information about an economy: Short run Aggregate Supply: SRAS = Y = 5000r+ 14,400 Long run Aggregate Supply: Aggregate Demand: Investment Spending: Consumption Spending: Government Spending: Net Exports (eX – iM): LRAS = Y* = 25,000 AD = Y=C+I+G+NX_ I = 4000 – 250r C = 1000 +0.75(Y – T) G = 2000 NX = 500 Taxes – Transfers: T = 2400 Monetary Policy: Money Demand: Money Market equilibrium: Fisher equation: where i is the nominal interest rate (i.e. when the interest rate is 7%, it means i= 7) r = 2 n м 3 20,000- 2000i M$ = MD i = r+T e. Find the short run equilibrium level of real GDP (Y), and inflation rate (t), in the short run. What is the output gap in the economy? Is it an expansionary or recessionary gap?arrow_forward
- Use the information in the table to answer the questions that follow. (Hint: Assume this is a closed economy without an international sector; thus, X - M=0. Also assume that there is no government spending in this economy.) Level of Employment (Millions of workers) 40 45 50 55 60 65 70 The equilibrium level of real GDP in this economy is S Employment, Output, Consumption, and Investment Real GDP (Output) Equals Disposable Income (Billions of dollars) 325 45 50 55 70 375 425 60 65 475 525 575 If the full-employment output level is $525 billion, the economy is experiencing 625 billion. 425 Employment, Output, Consumption, and Investment Level of Employment Real GDP (Output) Equals Disposable Income (Millions of workers) (Billions of dollars) 40 325 375 475 525 575 Consumption (Billions of dollars) 300 625 325 350 375 400 425 450 Use the information in the next table to answer the questions that follow. (Hint: Assume this is a closed economy without an international sector; thus, X- M =…arrow_forwardThe graph below is associated with a hypothetical country. Consider an increase in aggregate demand (AD). Specifically, aggregate demand shifts to the right from AD1AD1 to AD2AD2, causing the quantity of output demanded to rise at each price level. For instance, at a price level of 140, output is now $400 billion, where initially it was $300 billion. Fill in the missing values in the table by selecting the change in each scenario required to increase aggregate demand. Change required to increase AD Expected rate of return on investment. (decrease/increase) Incomes in other countries (decrease/increase) Consumer expectations about future profitability. (improve/worsen) Government spending (increase/decrease)arrow_forwardAs you know, supply and demand shifts are caused by one of their determinants. Shifts in aggregate demand (AD) show the effect of events on price level and Real GDP. Any event that causes a change in consumer, business, or government spending or any change in net exports (C+l+G+Xn) will shift AD. Any event that causes a change in production costs or increases productivity will shift aggregate supply (AS). Decide if the following events are Micro, shifting supply or demand, or Macro, shifting AD or AS. Give the direction in which the graph shifts. Demand Situation Aggregate Supply Aggregate Demand Supply Sales of Atlanta Braves gear grows with the success of the team. 1. The President and Congress pass a trillion dollar stimulus bill to provide aid during recession. 2. 3. Salmonella outbreak in peanut processing plants threatens lunches for school children. 4. Pomegranates are shown to be cancer fighting superfoods. Value of U.S. dollars declines, exports increase. 5. Global oil prices…arrow_forward
arrow_back_ios
SEE MORE QUESTIONS
arrow_forward_ios
Recommended textbooks for you


 Macroeconomics: Private and Public Choice (MindTa...EconomicsISBN:9781305506756Author:James D. Gwartney, Richard L. Stroup, Russell S. Sobel, David A. MacphersonPublisher:Cengage Learning
 Economics: Private and Public Choice (MindTap Cou...EconomicsISBN:9781305506725Author:James D. Gwartney, Richard L. Stroup, Russell S. Sobel, David A. MacphersonPublisher:Cengage Learning
Macroeconomics: Private and Public Choice (MindTa...
Economics
ISBN:9781305506756
Author:James D. Gwartney, Richard L. Stroup, Russell S. Sobel, David A. Macpherson
Publisher:Cengage Learning
Economics: Private and Public Choice (MindTap Cou...
Economics
ISBN:9781305506725
Author:James D. Gwartney, Richard L. Stroup, Russell S. Sobel, David A. Macpherson
Publisher:Cengage Learning