
Videos
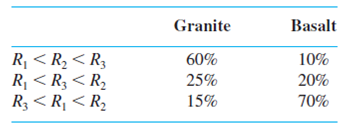
One method used to distinguish between granitic (G) and basaltic (B) rocks is to examine a portion of the infrared spectrum of the sun’s energy reflected from the rock surface. Let R1, R2, and R3 denote measured spectrum intensities at three different wavelengths; typically, for granite R1 < R2 < R3, whereas for basalt R3 < R1 < R2. When measurements are made remotely (using aircraft), various orderings of the Ris may arise whether the rock is basalt or granite. Flights over regions of known composition have yielded the following information:
Suppose that for a randomly selected rock in a certain region, P(granite) 5 .25 and P(basalt) 5 .75.
- a. Show that P(granite | R1 < R2 < R3) > P(basalt | R1 < R2 < R3). If measurements yielded R1 < R2 < R3, would you classify the rock as granite or basalt?
- b. If measurements yielded R1 < R3 < R2, how would you classify the rock? Answer the same question for R3 < R1 < R2.
- c. Using the classification rules indicated in parts (a) and (b), when selecting a rock from this region, what is the probability of an erroneous classification? [Hint: Either G could be classified as B or B as G, and P(B) and P(G) are known.]
- d. If P(granite) = p rather than .25, are there values of p (other than 1) for which one would always classify a rock as granite?
a.
Show that
Explain whether the granite or basalt is classified as rock.
Answer to Problem 106SE
It has been verified that
The rock is classified as granite.
Explanation of Solution
Given info:
The information is based on the method that helps to differentiate between the granite and basaltic rocks to examine between the infrared spectrums of the sun’s energy from the rock surface. The events
The composition of the salts is obtained in the table given below:
| Granite | Basalt | |
| 60% | 10% | |
| 25% | 20% | |
| 15% | 70% |
Calculation:
Bayles’ rule:
If
Here,
Law of total probability:
Assume that the eventsA1, A2, A3,…,Ak be mutually exclusive and exhaustive events.
For any event B,
The probability of B is obtained as:
Define the events:
The probability of the corresponding event is given below:
The probability of the granite and
The probability of the granite and
The probability of the granite and
The probability of the basalt and
The probability of the basalt and
The probability of the basalt and
Here, the probabilities of the events are represented using tree diagram given below:
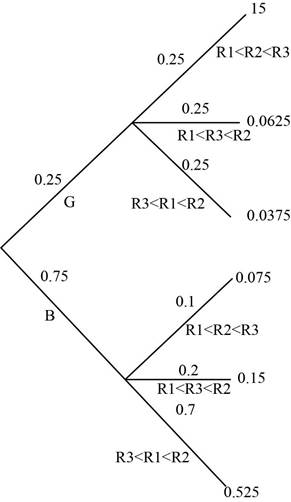
By using law of total probability, the probability of the
Thus, the probability of
The probability of
Thus the
The probability of
Thus the
Hence, the probability of
b.
Explain whether the rock is classified as granite or basalt.
Answer to Problem 106SE
For both
Explanation of Solution
Calculation:
By using law of total probability, the probability of the
Thus, the probability of
The probability of
Here, the probability is less than 0.5. It is classified as basalt.
The probability of
Here, the probability is less than 0.5. It is classified as basalt.
c.
Obtain the probability of an erroneous classification.
Answer to Problem 106SE
The probability of an erroneous classification is 0.175.
Explanation of Solution
Here, G denotes granite and B denotes basalt.
The probability of the erroneous classification is obtained as shown below:
Thus, the probability of the erroneous classification is 0.1625.
d.
Identify for which value of p the rock can be classified as granite.
Answer to Problem 106SE
The rock can be classified as granite if and only if
Explanation of Solution
Calculation:
The probability of
Thus, the
The probability of
Thus, the
The probability of
Thus, the
Here,
Want to see more full solutions like this?
Chapter 2 Solutions
DEVORE'S PROB & STATS F/ENG WEBASSIGN


- Repeat Example 5 when microphone A receives the sound 4 seconds before microphone B.arrow_forwardA stamped sheet steel plate is shown in Figure 164. Compute dimensions AF to 3 decimal places. All dimensions are in inches. A=_B=_C=_D=_E=_F=_arrow_forwardIn an experiment to determine the effect of ambient temperature on the emissons of oxides of nitrogen ( NOx ) of diesel trucks, 10 trucks were run at temperatures of 40°F and 80°F . The emissions, in parts per billion, are presented in the following table. Truck 40°F 80°F 1 926.5 896.7 2 851.1 857.0 3 975.5 952.1 4 1009.3 884.8 5 871.8 840.7 6 949.2 885.1 7 1006.3 885.5 8 836.5 777.8 9 837.8 850.2 10 958.9 882.1 Send data to Excel Let μ1 represent the mean emission at 40°F and =μd−μ1μ2 .Can you conclude that the mean emission differs between the two temperatures? Use the =α0.05 level of significance and the TI-84 Plus calculator to answer the following. p value ? do we reject? is there enough evidence :?arrow_forward
- Need help with parts d and k. Data: TSERofReturn AcmeRofReturn 1 0.42478 -0.48194 2 1.61213 -0.73284 3 -0.98754 -2.28445 4 -0.30013 -1.55312 5 1.41215 0.68674 6 0.68725 -1.31132 7 0.03733 -0.83295 8 -1.72494 -1.71975 9 0.33729 1.14443 10 -1.07502 -1.79885 11 0.86222 0.89736 12 1.17468 1.66664 13 -0.38761 -0.02658 14 1.66212 0.9086 15 1.09969 1.99935 16 -0.06266 0.46148 17 -1.96241 -1.41004 18 -1.32499 -0.38086 19 -1.51247 -1.90904 20 0.74974 0.91873 21 -0.38761 -0.49714 22 -0.17514 -1.31385 23 -3.41222 -1.15681 24 -0.01266 2.11718 25 0.16231 1.78766 26 -0.82506 1.30344 27 -0.41261 -0.43377 28 0.2623 -1.70274 29 -1.16251 0.4692 30 -1.05003 0.27671 31 -0.65008 -0.63741 32 0.62475 2.9895 33 -0.68758 1.3613 34…arrow_forwardSuppose you will perform a test to determine whether there is sufficient evidence to support a claim of a linear correlation between two variables. Find the critical value(s) of r given that n = 20 and α = 0.05. Group of answer choices r = ±0.632 r = ±0.456 r = ±0.811 r = ±0.444arrow_forward5. A consumer buying cooperative tested the effective heating area of 20 different electric space heaters with different wattages. Here are the results. Heater Wattage Area 1 750 291 2 1,750 83 3 1,250 215 4 1,750 209 5 1,500 295 6 750 153 7 1,000 40 8 750 166 9 1,250 115 10 1,250 146 11 750 113 12 1,000 56 13 1,750 284 14 1,000 45 15 750 82 16 1,250 175 17 750 150 18 1,500 231 19 1,000 87 20 750 52 Click here for the Excel Data FileRequired:a. Compute the correlation between the wattage and heating area. Is there a direct or an indirect relationship? (Round your answer to 4 decimal places.) b. Conduct a test of hypothesis to determine if it is reasonable that the coefficient is greater than zero. Use the 0.050 significance level. (Round intermediate calculations and final answer to 3 decimal places.)H0: ρ ≤ 0; H1: ρ > 0 Reject H0 if t > 1.734…arrow_forward
- Question 2Identify the following variables as qualitative or quantitative. (c) the fast-food establishment preferred by customers such as McDonalds orBurger King.(d) the mercury concentration in a sample of tuna.arrow_forwardThe following data refers to yield of tomatoes (kg/plot) for four different levels of salinity. Salinity level here refers to electrical conductivity (EC), where the chosen levels were EC = 1.6, 3.8, 6.0, and 10.2 nmhos/cm. (Use i = 1, 2, 3, and 4 respectively.) 1.6: 59.1 53.1 56.9 63.8 58.1 3.8: 55.6 59.1 52.8 54.1 6.0: 51.6 48.6 53.5 49.2 10.2: 44.7 48.9 40.9 47.5 46.5 Calculate the test statistic. (Round your answer to two decimal places.)arrow_forwardcalculate d and e with good working outs ...arrow_forward
 Mathematics For Machine TechnologyAdvanced MathISBN:9781337798310Author:Peterson, John.Publisher:Cengage Learning,
 Algebra & Trigonometry with Analytic GeometryAlgebraISBN:9781133382119Author:SwokowskiPublisher:Cengage
 Trigonometry (MindTap Course List)TrigonometryISBN:9781337278461Author:Ron LarsonPublisher:Cengage Learning