
Concept explainers
Videos
Interpretation:
Temperature of Gas B needs to be determined having volume of
Concept introduction:
Visual display of data is defined as a graph. By using the given data, a student can create graph. Graph helps to understand any data easily.
Answer to Problem 10STP
Correct answer: The correct option is (b).
Explanation of Solution
Reason for correct option: The points on a line graph represent the intersection of data for two variables. First one is Independent variable, plotted on the
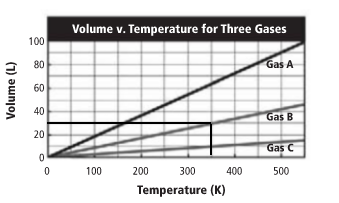
According to the Graph, temperature of Gas B is 350 K at 30 L volume.
After analyzing the graph, the correct option is (b).
Chapter 2 Solutions
Chemistry: Matter and Change
Additional Science Textbook Solutions
Chemistry: Structure and Properties (2nd Edition)
Organic Chemistry
General, Organic, and Biological Chemistry (3rd Edition)
CHEMISTRY-TEXT
Inorganic Chemistry
Chemistry: The Central Science (13th Edition)


 ChemistryChemistryISBN:9781305957404Author:Steven S. Zumdahl, Susan A. Zumdahl, Donald J. DeCostePublisher:Cengage Learning
 ChemistryChemistryISBN:9781259911156Author:Raymond Chang Dr., Jason Overby ProfessorPublisher:McGraw-Hill Education
 Principles of Instrumental AnalysisChemistryISBN:9781305577213Author:Douglas A. Skoog, F. James Holler, Stanley R. CrouchPublisher:Cengage Learning
 Organic ChemistryChemistryISBN:9780078021558Author:Janice Gorzynski Smith Dr.Publisher:McGraw-Hill Education
 Chemistry: Principles and ReactionsChemistryISBN:9781305079373Author:William L. Masterton, Cecile N. HurleyPublisher:Cengage Learning
 Elementary Principles of Chemical Processes, Bind...ChemistryISBN:9781118431221Author:Richard M. Felder, Ronald W. Rousseau, Lisa G. BullardPublisher:WILEY