
Concept explainers
Videos
To explain: whether the given data is a Normal probability plot.
Answer to Problem 11CRE
The given data does not follow
Explanation of Solution
Given:
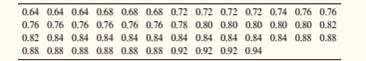
Calculation:
The histogram and normal probability plot of the given data are as follows:
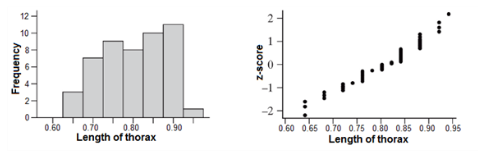
From the histogram, it is seen that the data is more concentrated towards the right side. Hence, it is said that the data is not symmetric. Also, in the normal probability plot, all points are not close to straight line. Hence, it is said that the data is not normally distributed.
The
The descriptive statistics given above indicate that the mean and median are very similar which is consistent with rough symmetry.
From the above descriptive statistics, the mean length of the given data,
According to
First calculate
The given data contains 28 observations which are within 0.7222 and 0.8786.
That is,
Calculate
The given data contains 47 observations which are within 0.644 and 0.9568.
That is,
Calculate
The given data contains all 49 observations which are within 0.5658 and 1.035.
That is,
As the above data, does not satisfy the empirical rule, it is concluded the given data does not follow normal distribution.
Conclusion:
Therefore, the given data does not follow normal distribution.
Chapter 2 Solutions
The Practice of Statistics for AP - 4th Edition
Additional Math Textbook Solutions
Elementary Statistics: Picturing the World (6th Edition)
Intro Stats, Books a la Carte Edition (5th Edition)
STATS:DATA+MODELS-W/DVD
Basic Business Statistics, Student Value Edition
Introductory Statistics (10th Edition)
Statistical Reasoning for Everyday Life (5th Edition)


 MATLAB: An Introduction with ApplicationsStatisticsISBN:9781119256830Author:Amos GilatPublisher:John Wiley & Sons Inc
 Probability and Statistics for Engineering and th...StatisticsISBN:9781305251809Author:Jay L. DevorePublisher:Cengage Learning
 Statistics for The Behavioral Sciences (MindTap C...StatisticsISBN:9781305504912Author:Frederick J Gravetter, Larry B. WallnauPublisher:Cengage Learning
 Elementary Statistics: Picturing the World (7th E...StatisticsISBN:9780134683416Author:Ron Larson, Betsy FarberPublisher:PEARSON
 The Basic Practice of StatisticsStatisticsISBN:9781319042578Author:David S. Moore, William I. Notz, Michael A. FlignerPublisher:W. H. Freeman
 Introduction to the Practice of StatisticsStatisticsISBN:9781319013387Author:David S. Moore, George P. McCabe, Bruce A. CraigPublisher:W. H. Freeman