MyLab Statistics  with Pearson eText -- Standalone Access Card -- for Statistical Reasoning for Everyday Life (5th Edition)
MyLab Statistics with Pearson eText -- Standalone Access Card -- for Statistical Reasoning for Everyday Life (5th Edition)
5th Edition
ISBN: 9780134678528
Author: Jeff Bennett, William L. Briggs, Mario F. Triola
Publisher: PEARSON
bartleby

Concept explainers

bartleby

Videos

Textbook Question
Book Icon
Chapter 2, Problem 1.1F

Politics

Who Benefited Most from Lower Tax Rates?

Politicians have a remarkable capacity to cast numbers in whatever light best supports their positions. There are many ways in which numbers can be made to support a particular position, but one of the most common occurs through selective use of relative (percentages) and absolute numbers.

Consider the two charts shown in Figure 2.4. Both purport to show effects of the tax rate cuts enacted under President Bush in 2001, which remained in effect until tax rates were raised in 2013. The chart in Figure 2.4a, created by supporters of the tax cuts, indicates that the rich ended up paying more under the tax cuts than they would have otherwise. Figure 2.4b, created by opponents of the tax cuts, shows that the rich received far more benefit from the tax cuts than lower-income taxpayers. The two charts therefore seem contradictory, because the first seems to indicate that the rich paid more while the second seems to indicate that they paid less.

Which story is right? In fact, both of the graphs are accurate and show data from reputable sources. (The U.S. Department of the Treasury, cited as the source of the data for Figure 2.4a, is an agency of the federal government; the Joint Committee on Taxation, cited for Figure 2.4b, is a nonpartisan committee of the U.S. Congress.) The seemingly opposing claims arise from the way in which each group chose its data.

Chapter 2, Problem 1.1F, Politics Who Benefited Most from Lower Tax Rates? Politicians have a remarkable capacity to cast , example  1

The tax cut supporters show the percentage of total taxes that the rich paid with the cuts and what calculations suggest they would have paid without them. The title stating that the “rich pay more” therefore means that the tax cuts led them to pay a higher percentage of total taxes. However, if total tax revenue also was lower than it would have been without the cuts (as it was), a higher percentage of total taxes could still mean lower absolute dollars. It is these lower absolute dollars that are shown by the opponents of the tax cut.

Chapter 2, Problem 1.1F, Politics Who Benefited Most from Lower Tax Rates? Politicians have a remarkable capacity to cast , example  2

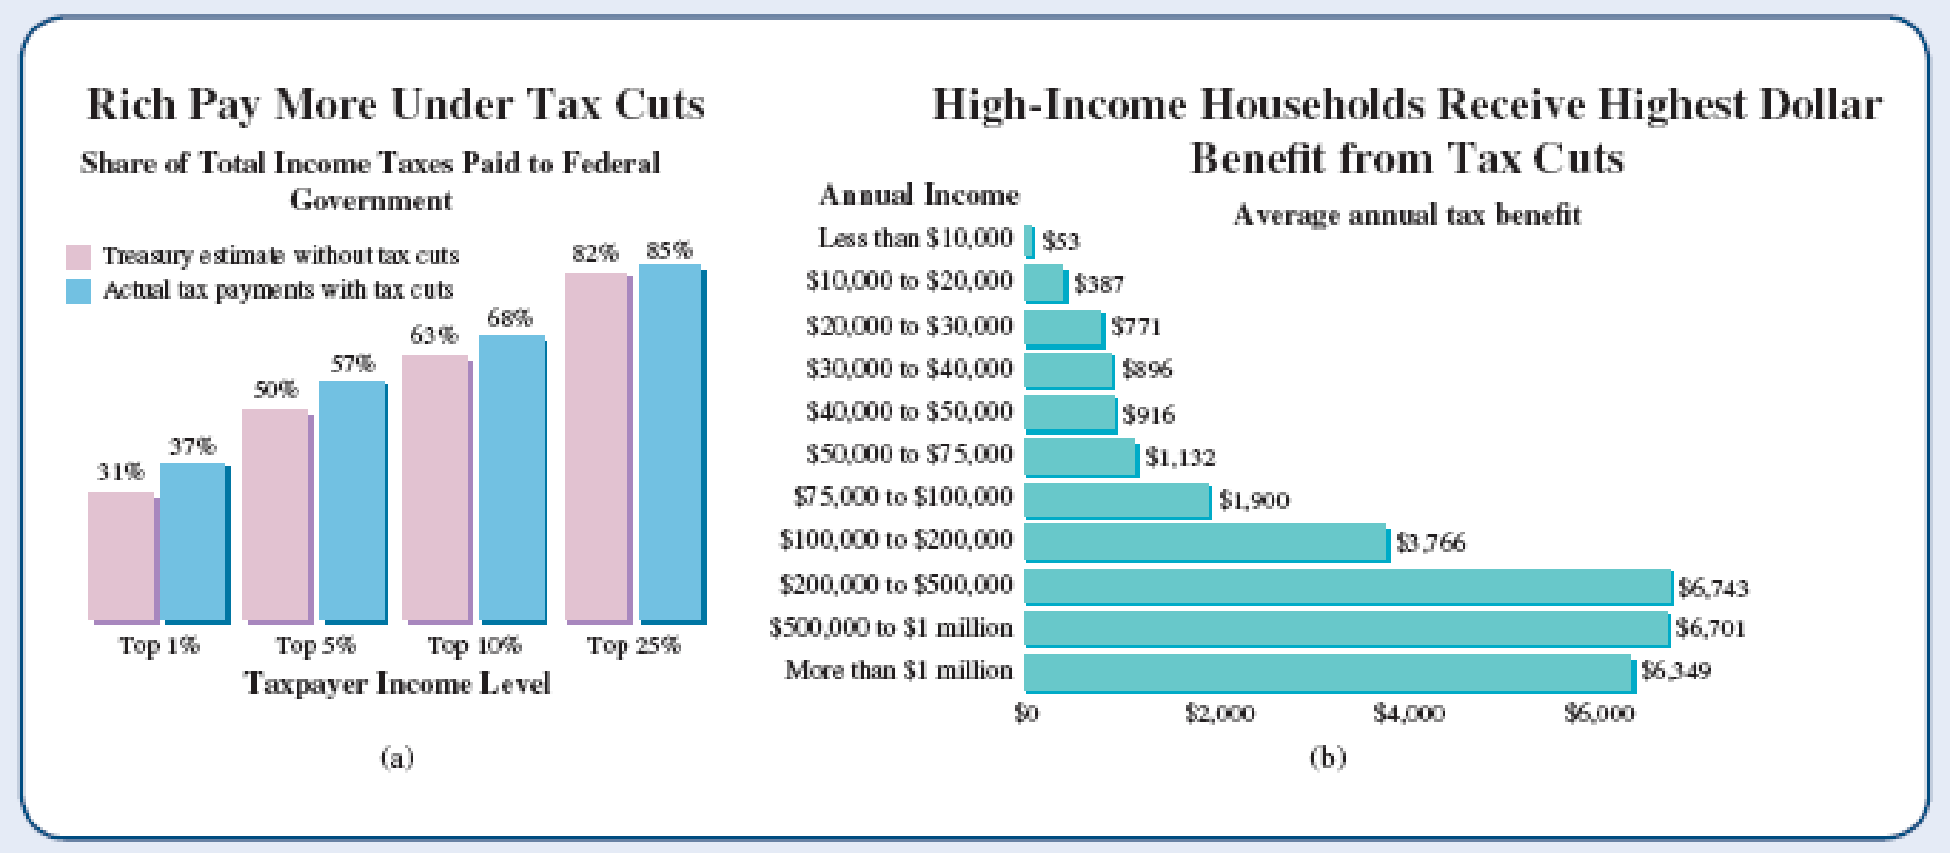
Figure 2.4 Both charts purport to show effects on higher-income households of tax cuts that were in effect from 2001 through 2012, but they were designed to support opposing conclusions. (a) Based on a graph published in The American—The Journal of the American Enterprise Institute. (b) Based on a graph published by the Center on Budget and Policy Priorities (cbpp.org).

Which side was being more fair? Neither, really. The supporters have deliberately focused on a relative change (percentage) in order to mask the absolute change, which would be less favorable to their position. The opponents focused on the absolute change, but neglected to mention the fact that the wealthy pay most of the taxes. Unfortunately, this type of “selective truth” is very common when it comes to numbers, especially those tied up in politics.

“Politicians and government officials usually abuse numbers and logic in the most elementary ways. They simply cook figures to suit their purpose, use obscure measures of economic performance, and indulge in horrendous examples of chart abuse, all in the name of disguising unpalatable truths.”

—A. K. Dewdney, 200% of Nothing

Questions for Discussion

Discuss the chart in Figure 2.4a. Why does it only show taxpayer income levels from the top 1% to the top 25%? What does it tell us about the relative tax burden on each group shown? Do you think its claim that the “rich pay more” is an honest depiction or a distortion of the facts? Defend your opinion.

Blurred answer

Chapter 2 Solutions

MyLab Statistics with Pearson eText -- Standalone Access Card -- for Statistical Reasoning for Everyday Life (5th Edition)

Ch. 2.1 - Does It Make Sense? For Exercises 58, determine...Ch. 2.1 - Does It Make Sense? For Exercises 58, determine...Ch. 2.1 - Does It Make Sense? For Exercises 58, determine...Ch. 2.1 - Does It Make Sense? For Exercises 58, determine...Ch. 2.1 - Does It Make Sense? For Exercises 58, determine...Ch. 2.1 - Does It Make Sense? For Exercises 58, determine...Ch. 2.1 - Qualitative versus Quantitative Data. In Exercises...Ch. 2.1 - Qualitative versus Quantitative Data. In Exercises...Ch. 2.1 - Discrete or Continuous. In Exercises 1928, state...Ch. 2.1 - Discrete or Continuous. In Exercises 1928, state...Ch. 2.1 - Discrete or Continuous. In Exercises 1928, state...Ch. 2.1 - Discrete or Continuous. In Exercises 1928, state...Ch. 2.1 - Discrete or Continuous. In Exercises 1928, state...Ch. 2.1 - Discrete or Continuous. In Exercises 1928, state...Ch. 2.1 - Discrete or Continuous. In Exercises 1928, state...Ch. 2.1 - Discrete or Continuous. In Exercises 1928, state...Ch. 2.1 - Discrete or Continuous. In Exercises 1928, state...Ch. 2.1 - Discrete or Continuous. In Exercises 1928, state...Ch. 2.1 - Levels of Measurement. For the data described in...Ch. 2.1 - Levels of Measurement. For the data described in...Ch. 2.1 - Levels of Measurement. For the data described in...Ch. 2.1 - Levels of Measurement. For the data described in...Ch. 2.1 - Levels of Measurement. For the data described in...Ch. 2.1 - Levels of Measurement. For the data described in...Ch. 2.1 - Levels of Measurement. For the data described in...Ch. 2.1 - Levels of Measurement. For the data described in...Ch. 2.1 - Levels of Measurement. For the data described in...Ch. 2.1 - Levels of Measurement. For the data described in...Ch. 2.1 - Levels of Measurement. For the data described in...Ch. 2.1 - Levels of Measurement. For the data described in...Ch. 2.1 - Meaningful Ratios? In Exercises 4148, determine...Ch. 2.1 - Meaningful Ratios? In Exercises 4148, determine...Ch. 2.1 - Meaningful Ratios? In Exercises 4148, determine...Ch. 2.1 - Meaningful Ratios? In Exercises 4148, determine...Ch. 2.1 - Meaningful Ratios? In Exercises 4148, determine...Ch. 2.1 - Meaningful Ratios? In Exercises 4148, determine...Ch. 2.1 - Meaningful Ratios? In Exercises 4148, determine...Ch. 2.1 - Meaningful Ratios? In Exercises 4148, determine...Ch. 2.1 - Complete Classification. In Exercises 4956,...Ch. 2.1 - Complete Classification. In Exercises 4956,...Ch. 2.1 - Complete Classification. In Exercises 4956,...Ch. 2.1 - Complete Classification. In Exercises 4956,...Ch. 2.1 - Prob. 53ECh. 2.1 - Complete Classification. In Exercises 4956,...Ch. 2.1 - Prob. 55ECh. 2.1 - Complete Classification. In Exercises 4956,...Ch. 2.2 - Error Type. Distinguish between random errors and...Ch. 2.2 - Absolute and Relative. Distinguish between the...Ch. 2.2 - Accuracy and Precision. Distinguish between...Ch. 2.2 - Honest Numbers. Why can it be misleading to give...Ch. 2.2 - Does It Make Sense? For Exercises 58, determine...Ch. 2.2 - Does It Make Sense? For Exercises 58, determine...Ch. 2.2 - Does It Make Sense? For Exercises 58, determine...Ch. 2.2 - Does It Make Sense? For Exercises 58, determine...Ch. 2.2 - IRS. An IRS agent reviews tax returns to identify...Ch. 2.2 - Safe Air Travel. Before taking off, a pilot is...Ch. 2.2 - Technical Specifications. A smartphone battery is...Ch. 2.2 - Crime Statistics. Former New York City Police...Ch. 2.2 - Sources of Errors. For each measurement described...Ch. 2.2 - Sources of Errors. For each measurement described...Ch. 2.2 - Sources of Errors. For each measurement described...Ch. 2.2 - Sources of Errors. For each measurement described...Ch. 2.2 - Sources of Errors. For each measurement described...Ch. 2.2 - Sources of Errors. For each measurement described...Ch. 2.2 - Sources of Errors. For each measurement described...Ch. 2.2 - Sources of Errors. For each measurement described...Ch. 2.2 - Absolute and Relative Errors. In Exercises 2124,...Ch. 2.2 - Absolute and Relative Errors. In Exercises 2124,...Ch. 2.2 - Absolute and Relative Errors. In Exercises 2124,...Ch. 2.2 - Absolute and Relative Errors. In Exercises 2124,...Ch. 2.2 - Minimizing Errors. Twenty-five people, including...Ch. 2.2 - Minimizing Errors. When a model 22F car battery is...Ch. 2.2 - Accuracy and Precision in Corvette Weight. A new...Ch. 2.2 - Accuracy and Precision in Height. Assume that your...Ch. 2.2 - Accuracy and Precision in Weight. Suppose your...Ch. 2.2 - Prob. 30ECh. 2.2 - Believable Facts? Exercises 3138 give statements...Ch. 2.2 - Believable Facts? Exercises 3138 give statements...Ch. 2.2 - Prob. 33ECh. 2.2 - Believable Facts? Exercises 3138 give statements...Ch. 2.2 - Prob. 35ECh. 2.2 - Believable Facts? Exercises 3138 give statements...Ch. 2.2 - Believable Facts? Exercises 3138 give statements...Ch. 2.2 - Believable Facts? Exercises 3138 give statements...Ch. 2.3 - Statistical Literacy and Critical Thinking...Ch. 2.3 - Percentage Difference. Distinguish between...Ch. 2.3 - Of versus More Than. Explain the difference...Ch. 2.3 - Percentage Points. Explain the difference between...Ch. 2.3 - Does It Make Sense? For Exercises 58, determine...Ch. 2.3 - Does It Make Sense? For Exercises 58, determine...Ch. 2.3 - Does It Make Sense? For Exercises 58, determine...Ch. 2.3 - Does It Make Sense? For Exercises 58, determine...Ch. 2.3 - Concepts and Applications Fractions, Decimals,...Ch. 2.3 - Fractions, Decimals, Percentages. Express the...Ch. 2.3 - Percentage Practice. A study was conducted of...Ch. 2.3 - Percentage Practice. A study was conducted to...Ch. 2.3 - Percentage of Media commonly report survey...Ch. 2.3 - Percentage. A New York Times editorial criticized...Ch. 2.3 - Relative Change. Exercises 1522 each provide two...Ch. 2.3 - Relative Change. Exercises 1522 each provide two...Ch. 2.3 - Relative Change. Exercises 1522 each provide two...Ch. 2.3 - Relative Change. Exercises 1522 each provide two...Ch. 2.3 - Relative Change. Exercises 1522 each provide two...Ch. 2.3 - Relative Change. Exercises 1522 each provide two...Ch. 2.3 - Relative Change. Exercises 1522 each provide two...Ch. 2.3 - Relative Change. Exercises 1522 each provide two...Ch. 2.3 - Surveys. Some important analyses of survey results...Ch. 2.3 - Surveys. Some important analyses of survey results...Ch. 2.3 - Surveys. Some important analyses of survey results...Ch. 2.3 - Surveys. Some important analyses of survey results...Ch. 2.3 - Of versus More Than. Fill in the blanks in...Ch. 2.3 - Of versus More Than. Fill in the blanks in...Ch. 2.3 - Of versus More Than. Fill in the blanks in...Ch. 2.3 - Of versus More Than. Fill in the blanks in...Ch. 2.3 - Margin of Error. A Gallup poll of 1012 American...Ch. 2.3 - Margin of Error. A Pew Research Center survey of...Ch. 2.3 - Percentages of Percentages. Exercises 3336...Ch. 2.3 - Percentages of Percentages. Exercises 3336...Ch. 2.3 - Percentages of Percentages. Exercises 3336...Ch. 2.3 - Percentages of Percentages. Exercises 3336...Ch. 2.3 - TV Share. A recent Super Bowl football game had a...Ch. 2.3 - Misleading Percentage. In a Gallup poll of 1236...Ch. 2.4 - Index Number. What is an index number? Briefly...Ch. 2.4 - CPI. What is the Consumer Price Index (CPI)? How...Ch. 2.4 - Inflation. In making price comparisons, why is it...Ch. 2.4 - CPI Change. If the CPI increases, must wages also...Ch. 2.4 - Does It Make Sense? For Exercises 58, determine...Ch. 2.4 - Does It Make Sense? For Exercises 58, determine...Ch. 2.4 - Does It Make Sense? For Exercises 58, determine...Ch. 2.4 - Does It Make Sense? For Exercises 58, determine...Ch. 2.4 - Consumer Price Index. In Exercises 916, use the...Ch. 2.4 - Consumer Price Index. In Exercises 916, use the...Ch. 2.4 - Consumer Price Index. In Exercises 916, use the...Ch. 2.4 - Consumer Price Index. In Exercises 916, use the...Ch. 2.4 - Prob. 13ECh. 2.4 - Consumer Price Index. In Exercises 916, use the...Ch. 2.4 - Consumer Price Index. In Exercises 916, use the...Ch. 2.4 - Consumer Price Index. In Exercises 916, use the...Ch. 2.4 - Coffee Index. In Exercises 1720, use the following...Ch. 2.4 - Prob. 18ECh. 2.4 - Prob. 19ECh. 2.4 - Coffee Index. In Exercises 1720, use the following...Ch. 2.4 - Pizza Cost and Subway Fare. The pizza connection...Ch. 2.4 - Pizza Cost and Subway Fare. The pizza connection...Ch. 2.4 - Pizza Cost and Subway Fare. The pizza connection...Ch. 2.4 - Pizza Cost and Subway Fare. The pizza connection...Ch. 2.4 - Prob. 25ECh. 2.4 - Prob. 26ECh. 2.4 - Prob. 27ECh. 2.4 - Housing Price Index. Realtors use an index to...Ch. 2.4 - Prob. 29ECh. 2.4 - Housing Price Index. Realtors use an index to...Ch. 2.4 - Prob. 31ECh. 2.4 - Housing Price Index. Realtors use an index to...Ch. 2 - Germs. In a Wakefield Research survey, 1003...Ch. 2 - Health Care Spending. Total spending on health...Ch. 2 - Prob. 3CRECh. 2 - Minimum Wage. The following table lists the...Ch. 2 - Braking reaction times of 36 randomly selected...Ch. 2 - What is the level of measurement of the values...Ch. 2 - Prob. 3CQCh. 2 - A researcher measures the braking reaction time of...Ch. 2 - Braking reaction times of 36 randomly selected...Ch. 2 - Recorded survey results include the states in...Ch. 2 - Prob. 7CQCh. 2 - Prob. 8CQCh. 2 - Prob. 9CQCh. 2 - Prob. 10CQCh. 2 - Politics Who Benefited Most from Lower Tax Rates?...Ch. 2 - Prob. 1.2FCh. 2 - Prob. 1.3F
Knowledge Booster
Background pattern image
Statistics
Learn more about
Need a deep-dive on the concept behind this application? Look no further. Learn more about this topic, statistics and related others by exploring similar questions and additional content below.
Recommended textbooks for you
Text book image
Algebra and Trigonometry (MindTap Course List)
Algebra
ISBN:9781305071742
Author:James Stewart, Lothar Redlin, Saleem Watson
Publisher:Cengage Learning
Text book image
Trigonometry (MindTap Course List)
Trigonometry
ISBN:9781337278461
Author:Ron Larson
Publisher:Cengage Learning
Text book image
Algebra & Trigonometry with Analytic Geometry
Algebra
ISBN:9781133382119
Author:Swokowski
Publisher:Cengage
Use of ALGEBRA in REAL LIFE; Author: Fast and Easy Maths !;https://www.youtube.com/watch?v=9_PbWFpvkDc;License: Standard YouTube License, CC-BY
Compound Interest Formula Explained, Investment, Monthly & Continuously, Word Problems, Algebra; Author: The Organic Chemistry Tutor;https://www.youtube.com/watch?v=P182Abv3fOk;License: Standard YouTube License, CC-BY
Applications of Algebra (Digit, Age, Work, Clock, Mixture and Rate Problems); Author: EngineerProf PH;https://www.youtube.com/watch?v=Y8aJ_wYCS2g;License: Standard YouTube License, CC-BY