
Videos
Interpretation A Harm Poll surveyed 2085 U.S. adults regarding use of cell phones while driving. All the adults were asked their opinion regarding how dangerous it is for a driver to use a cell phone while driving. Graph (a) shows the percentage responding "very dangerous" by age group. Only the adults who drive and who have a cell phone were asked how often they talk on the cell phone while driving. Graph (b) shows the percentage responding "never" by age group.
Cell Phone Use and Driving
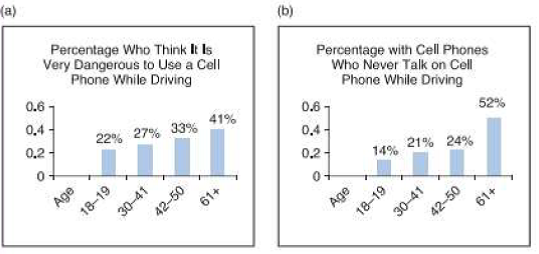
(a) What trend does this survey portray regarding age group and the opinion that using a cell phone while driving is very dangerous?
(b) How does the behavior of never using a cell phone while driving compare to the opinion that using a cell phone while driving is dangerous? Do you think that some of the differences in the behavior (never use a cell phone while driving) and the opinion (using a cell phone while driving is very dangerous) can be attributed to the differences in the survey population? Explain.

Trending nowThis is a popular solution!

Chapter 2 Solutions
Understanding Basic Statistics


 Algebra & Trigonometry with Analytic GeometryAlgebraISBN:9781133382119Author:SwokowskiPublisher:Cengage
 Glencoe Algebra 1, Student Edition, 9780079039897...AlgebraISBN:9780079039897Author:CarterPublisher:McGraw Hill
 Big Ideas Math A Bridge To Success Algebra 1: Stu...AlgebraISBN:9781680331141Author:HOUGHTON MIFFLIN HARCOURTPublisher:Houghton Mifflin Harcourt