Understanding Basic Statistics
8th Edition
ISBN: 9781337558075
Author: Charles Henry Brase, Corrinne Pellillo Brase
Publisher: Cengage Learning
bartleby

Videos

Textbook Question
Book Icon
Chapter 2.2, Problem 6P

Interpretation Consider the two graphs depicting the influence of advertisements on making large purchases for two different age groups, those 18 to 34 years old and those 45 to 54 years old (based on a Harris Poll of about 2500 adults aged 18 or older). Note: Other responses such as "not sure" and "not applicable" were also possible.

Influence of Advertising on Most Recent Large Purchase

Chapter 2.2, Problem 6P, Interpretation Consider the two graphs depicting the influence of advertisements on making large

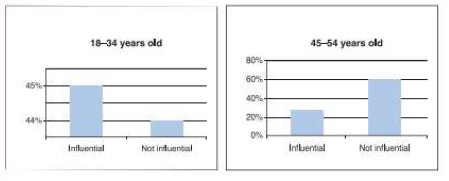
(a) Taking a quick glance at the graphs, Jenna thought that there was very little difference (maybe less than 1%) in the percentage of the two age groups who said that ads were influential. How would you change the graphs so that Jenna would not be misled so easily? Hint: Look at the vertical scales of the two graphs.

(b) Take the information from the two graphs and make a cluster bar graph showing the percentage by age group reporting to be influenced by ads and those reporting they were not influenced by ads.

Blurred answer

Chapter 2 Solutions

Understanding Basic Statistics

Ch. 2.1 - Interpretation Histograms of random sample data...Ch. 2.1 - Interpretation The following histograms are based...Ch. 2.1 - Interpretation The ogives shown are based on U.S...Ch. 2.1 - Critical Thinking The following ogives come from...Ch. 2.1 - For Problems 15-20. use the specified number of...Ch. 2.1 - For Problems 15-20, use the specified number of...Ch. 2.1 - For Problems 15-20, use the specified number of...Ch. 2.1 - For Problems 15-20, use the specified number of...Ch. 2.1 - For Problems 15-20, use the specified number of...Ch. 2.1 - For Problems 15-20. use the specified number of...Ch. 2.1 - Expand Your knowledge: Decimal Data The fallowing...Ch. 2.1 - Decimal Data: Batting Averages The following data...Ch. 2.1 - Expand Your Knowledge: Dotplot another display...Ch. 2.1 - 24. Dotplot: Sled Dog Racing Make a dotplot for...Ch. 2.1 - Prob. 25PCh. 2.2 - 1. Interpretation Consider graph (a) of Reasons...Ch. 2.2 - Interpretation Look at graph (b) of Reasons People...Ch. 2.2 - Critical Thinking A personnel office is gathering...Ch. 2.2 - Critical Thinking Your friend is thinking about...Ch. 2.2 - Education: Does College Pay Off? It is costly in...Ch. 2.2 - Interpretation Consider the two graphs depicting...Ch. 2.2 - Commercial Fishing: Gulf of Alaska It's not an...Ch. 2.2 - Archaeology: Ireland Commercial dredging...Ch. 2.2 - Lifestyle: Hide the Mess! A survey of 1000 adults...Ch. 2.2 - Education: College Professors' Time How do college...Ch. 2.2 - FBI Report: Hawaii In the Aloha state, you are...Ch. 2.2 - Driving: Bad Habits Driving would be more pleasant...Ch. 2.2 - 13Ecology: Lakes Pyramid Lake, Nevada, is...Ch. 2.2 - Vital Statistics: Height How dies average height...Ch. 2.2 - Expand Your Knowledge Donut Pie Charts The book...Ch. 2.2 - Technology: Cars The following cluster bar graph...Ch. 2.3 - Cowboys: Longevity How long did real cowboys live?...Ch. 2.3 - Ecology: Habitat Wetlands offer a diversity of...Ch. 2.3 - Health Care: Hospitals The American Medical...Ch. 2.3 - Health Care: Hospitals Using the number of...Ch. 2.3 - Expand Your knowledge: Split Stem The Boston...Ch. 2.3 - Split Stem: Golf The U.S. Open Golf Tournament was...Ch. 2.3 - Are cigarettes bad for people? Cigarette smoking...Ch. 2.3 - Are cigarettes bad for people? Cigarette smoking...Ch. 2.3 - Are cigarettes bad for people? Cigarette smoking...Ch. 2.3 - Expand Your Knowledge: Back-to-Back Stem Plot In...Ch. 2 - Terminology Consider the following graph types:...Ch. 2 - Terminology Whichtype(s) of data can be shown in a...Ch. 2 - Terminology Which type(s) of data can be shown in...Ch. 2 - Terminology Which graphical display shows each...Ch. 2 - Terminology If a histogram is skewed left, more of...Ch. 2 - Terminology How are data plotted in a time-series...Ch. 2 - Critical Thinking Consider these types of graphs:...Ch. 2 - Critical Thinking A consumer interest group is...Ch. 2 - Critical Thinking Describe how data outliers might...Ch. 2 - Expand Your Knowledge How are dotplots and...Ch. 2 - Focus Problem: Fuel Economy Solve the focus...Ch. 2 - Criminal Justice: Prisoners The time plot in...Ch. 2 - IRS: Tax Returns Almost everyone files (or will...Ch. 2 - Law Enforcement: DUI Driving under the influence...Ch. 2 - Agriculture: Apple Trees The following data...Ch. 2 - Law: Corporation Lawsuits Many people say the...Ch. 2 - Archaeology: Tree-King DataThe Sand Canyon...Ch. 2 - Interpretation A Harm Poll surveyed 2085 U.S....Ch. 2 - Examine Figure 2-20, Everyone Agrees: Slobs Make...Ch. 2 - Examine Figure 2-21, Global Teen Worries. How many...Ch. 2 - In your own words, explain the differences among...Ch. 2 - What do we mean when we say a histogram is skewed...Ch. 2 - Discuss the statement that stem-and-leaf displays...Ch. 2 - The following tables show the first-round winning...Ch. 2 - The following tables show the first-round winning...Ch. 2 - The Following tables show the first-round winning...
Knowledge Booster
Background pattern image
Statistics
Learn more about
Need a deep-dive on the concept behind this application? Look no further. Learn more about this topic, statistics and related others by exploring similar questions and additional content below.
Recommended textbooks for you
Text book image
Big Ideas Math A Bridge To Success Algebra 1: Stu...
Algebra
ISBN:9781680331141
Author:HOUGHTON MIFFLIN HARCOURT
Publisher:Houghton Mifflin Harcourt
Text book image
College Algebra
Algebra
ISBN:9781337282291
Author:Ron Larson
Publisher:Cengage Learning
Text book image
Algebra & Trigonometry with Analytic Geometry
Algebra
ISBN:9781133382119
Author:Swokowski
Publisher:Cengage
Text book image
Glencoe Algebra 1, Student Edition, 9780079039897...
Algebra
ISBN:9780079039897
Author:Carter
Publisher:McGraw Hill
Hypothesis Testing using Confidence Interval Approach; Author: BUM2413 Applied Statistics UMP;https://www.youtube.com/watch?v=Hq1l3e9pLyY;License: Standard YouTube License, CC-BY
Hypothesis Testing - Difference of Two Means - Student's -Distribution & Normal Distribution; Author: The Organic Chemistry Tutor;https://www.youtube.com/watch?v=UcZwyzwWU7o;License: Standard Youtube License