Essentials of Modern Business Statistics with Microsoft Office Excel (Book Only)
7th Edition
ISBN: 9781337298353
Author: David R. Anderson, Dennis J. Sweeney, Thomas A. Williams
Publisher: South-Western College Pub
bartleby

Videos

Textbook Question
Book Icon
Chapter 2, Problem 2.2.1CP

Case Problem 2  Motion Picture Industry
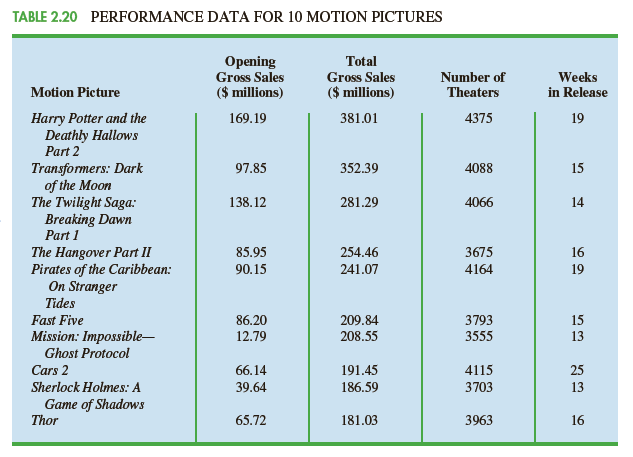
The motion picture industry is a competitive business. More than 50 studios produce a total of 300 to 400 new motion pictures each year, and the financial success of each motion picture varies considerably. The opening weekend sales ($ millions), the total gross sales ($ millions), the number of theaters the movie was shown in, and the number of weeks the motion picture was in release are common variables used to measure the success of a motion picture. Data collected for the top I (X) motion pictures produced in 2011 are contained in the DATAfile named 2011Movies (Box Office Mojo, March 17, 2012). Table 2.20 shows the for the first 10 motion pictures in this file.
Chapter 2, Problem 2.2.1CP, Case Problem 2Motion Picture Industry The motion picture industry is a competitive business. More
Managerial Report
Use the tabular and graphical methods of descriptive statistics to learn how these variables contribute to the success of a motion picture. Include the following in your report.
1. Tabular and graphical summaries for each of the four variables along with a discussion of what each summary tells us about the motion picture industry.

Blurred answer
Students have asked these similar questions
QUESTION 3 A business has two types of employees - managers and workers.  Managers earn either $100,000 or $200,000 a year.  Workers earn either $10,000 or $20,000 a year.  The number of male and female managers at each salary level are shown in the first table below.  The number of male and female workers at each salary level are shown in the second table below.  Managers   $100,000 $200,000 Male 80 20 Female 20 30 Workers   $10,000 $20,000 Male 30 20 Female 20 80 These tables are converted to row percentages below: Managers   $100,000 $200,000 Male 80% 20% Female 40% 60% Workers   $10,000 $20,000 Male 60% 40% Female 20% 80% Looking at the data, broken down by type of employee, which of the following best describes the relationship between sex and salary? Group of answer choices-   (A) Broken down by employee type, females are more likely to earn a higher salary than males.  There is a higher percentage of female managers at the higher salary…
CAsE prOBLEM 4: hEAVENLy ChOCOLATEs WEBsiTE TrANsACTiONs Heavenly Chocolates manufactures and sells quality chocolate products at its plant and retail store located in Saratoga Springs, New York. Two years ago the company developed a website and began selling its products over the Internet. Website sales have exceeded the company’s expectations, and management is now considering strategies to increase sales even further. To learn more about the website customers, a sample of 50 Heavenly Chocolate transactions was selected from the previous month’s sales. Data showing the day of the week each transaction was made, the type of browser the customer used, the time spent on the website, the number of website pages viewed, and the amount spent by each of the 50 customers are contained in the file HeavenlyChocolates. A portion of the data are shown in Table 3.12. Heavenly Chocolates would like to use the sample data to determine if online shoppers who spend more time and view more pages also…

Chapter 2 Solutions

Essentials of Modern Business Statistics with Microsoft Office Excel (Book Only)

Ch. 2.2 - Consider the following data. a. Develop a...Ch. 2.2 - Consider the following frequency distribution...Ch. 2.2 - Prob. 13ECh. 2.2 - Prob. 14ECh. 2.2 - Prob. 15ECh. 2.2 - Construct a stem-and-leaf display for the...Ch. 2.2 - A doctor's office staff studied the waiting times...Ch. 2.2 - CBSSports.com developed the Total Player Ratings...Ch. 2.2 - Based on the tons handled in a year, the ports...Ch. 2.2 - The London School of Economics and the Harvard...Ch. 2.2 - Quantcast.com provides the number of people from...Ch. 2.2 - Entrepreneur magazine ranks franchises using...Ch. 2.2 - The following data show the year-to-date percent...Ch. 2.2 - Prob. 24ECh. 2.2 - Prob. 25ECh. 2.2 - The Flying Pig Half-Marathon (13.1 miles) had...Ch. 2.3 - The following data are for 30 observations...Ch. 2.3 - The following observations are for two...Ch. 2.3 - The Daytona 500 is a 500-mile automobile race held...Ch. 2.3 - The following crosstabulation shows the average...Ch. 2.3 - Prob. 31ECh. 2.3 - The following crosstabulation shows the number of...Ch. 2.4 - Prob. 36ECh. 2.4 - Consider the following data on two categorical...Ch. 2.4 - Prob. 38ECh. 2.4 - Prob. 39ECh. 2.4 - Prob. 40ECh. 2.4 - Prob. 41ECh. 2.4 - Prob. 42ECh. 2.4 - The Northwest regional manager of an outdoor...Ch. 2 - Approximately 1.5 million high school students...Ch. 2 - Data showing the population by state in millions...Ch. 2 - A startup company's ability to gain funding is a...Ch. 2 - Prob. 49SECh. 2 - Prob. 50SECh. 2 - Western University has only one women's softball...Ch. 2 - Prob. 53SECh. 2 - Prob. 57SECh. 2 - A zoo has categorized its visitors into three...Ch. 2 - Pelican Stores, a division of National Clothing,...Ch. 2 - Prob. 2.1.2CPCh. 2 - Pelican Stores, a division of National Clothing,...Ch. 2 - Pelican Stores, a division of National Clothing,...Ch. 2 - Case Problem 2Motion Picture Industry The motion...Ch. 2 - Prob. 2.2.2CPCh. 2 - Case Problem 2 Motion Picture Industry The motion...Ch. 2 - Case Problem 2 Motion Picture Industry The motion...Ch. 2 - Case Problem 3Queen City Cincinnati, Ohio, also...Ch. 2 - Case Problem 3Queen City Cincinnati, Ohio, also...Ch. 2 - Case Problem 3Queen City Cincinnati, Ohio, also...Ch. 2 - Case Problem 4Cut-Rate Machining, Inc. Jon...Ch. 2 - Case Problem 4Cut-Rate Machining, Inc. Jon...Ch. 2 - Case Problem 4Cut-Rate Machining, Inc. Jon...
Knowledge Booster
Background pattern image
Statistics
Learn more about
Need a deep-dive on the concept behind this application? Look no further. Learn more about this topic, statistics and related others by exploring similar questions and additional content below.
Recommended textbooks for you
  • Text book image
    Algebra for College Students
    Algebra
    ISBN:9781285195780
    Author:Jerome E. Kaufmann, Karen L. Schwitters
    Publisher:Cengage Learning
    Text book image
    Intermediate Algebra
    Algebra
    ISBN:9781285195728
    Author:Jerome E. Kaufmann, Karen L. Schwitters
    Publisher:Cengage Learning
Text book image
Algebra for College Students
Algebra
ISBN:9781285195780
Author:Jerome E. Kaufmann, Karen L. Schwitters
Publisher:Cengage Learning
Text book image
Intermediate Algebra
Algebra
ISBN:9781285195728
Author:Jerome E. Kaufmann, Karen L. Schwitters
Publisher:Cengage Learning
Time Series Analysis Theory & Uni-variate Forecasting Techniques; Author: Analytics University;https://www.youtube.com/watch?v=_X5q9FYLGxM;License: Standard YouTube License, CC-BY
Operations management 101: Time-series, forecasting introduction; Author: Brandoz Foltz;https://www.youtube.com/watch?v=EaqZP36ool8;License: Standard YouTube License, CC-BY