
Essentials of Modern Business Statistics with Microsoft Office Excel (Book Only)
7th Edition
ISBN: 9781337298353
Author: David R. Anderson, Dennis J. Sweeney, Thomas A. Williams
Publisher: South-Western College Pub
expand_more
expand_more
format_list_bulleted
Concept explainers
Videos
Textbook Question
Chapter 2.3, Problem 28E
The following observations are for two quantitative variables, x and y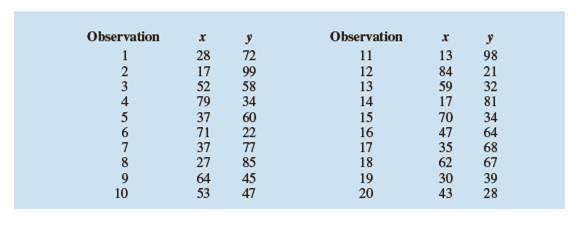
a. Develop a crosstabulation for the data, with x as the variable and y as the column variable. For x use classes of 10-29, 30-49, and so on; for y use classes of 40-59, 60-79, and so on.
b. Compute the row percentages.
c. Compute the column percentages.
d. What is the relationship, if any, between x and y?
Expert Solution & Answer
Want to see the full answer?
Check out a sample textbook solution
Students have asked these similar questions
Consider the following data set, where yy is the final grade in a math class and xx is the average number of hours the student spent working on math each week.
hours/weekx
Gradey
5
58
8
63.2
8
73.2
9
68.6
9
70.6
11
68.4
13
81.2
14
86.6
17
100
20
100
The regression equation is y=3.04⋅x+42.33y=3.04⋅x+42.33.Explain what the value of the slope means in this situation, where yy is the final grade in a math class and xx is the average number of hours the student spent working on math each week.Explain what the value of the y-intercept means in this situation.What is the predicted value for the final grade when a student spends an average of 15 hours each week on math?Grade = Round to 1 decimal place.
Given are five observations for two variables, and .
xi
1
3
12
15
17
yi
54
51
43
25
12
The estimated regression equation for these data is .
Complete the following for the (x, y) pairs of data points (1, 5), (3, 7), (4, 6), (5, 8), and (7, 9).a. Prepare a scatter plot of these data points.b. Compute b1.c. Compute b0.d. What is the equation of the regression line?
Chapter 2 Solutions
Essentials of Modern Business Statistics with Microsoft Office Excel (Book Only)
Ch. 2.1 - The response to a question has three alternatives:...Ch. 2.1 - A partial relative frequency distribution is...Ch. 2.1 - A questionnaire provides 58 Yes, 42 No, and 20...Ch. 2.1 - Prob. 4ECh. 2.1 - In alphabetical order, the six most common last...Ch. 2.1 - Nielsen Media Research provided the list of the 25...Ch. 2.1 - The Canmark Research Center Airport Customer...Ch. 2.1 - Prob. 8ECh. 2.1 - Nearly 1.8 million bachelor's degrees and over...Ch. 2.1 - VirtualTourist provides ratings for hotels...
Ch. 2.2 - Consider the following data. a. Develop a...Ch. 2.2 - Consider the following frequency distribution...Ch. 2.2 - Prob. 13ECh. 2.2 - Prob. 14ECh. 2.2 - Prob. 15ECh. 2.2 - Construct a stem-and-leaf display for the...Ch. 2.2 - A doctor's office staff studied the waiting times...Ch. 2.2 - CBSSports.com developed the Total Player Ratings...Ch. 2.2 - Based on the tons handled in a year, the ports...Ch. 2.2 - The London School of Economics and the Harvard...Ch. 2.2 - Quantcast.com provides the number of people from...Ch. 2.2 - Entrepreneur magazine ranks franchises using...Ch. 2.2 - The following data show the year-to-date percent...Ch. 2.2 - Prob. 24ECh. 2.2 - Prob. 25ECh. 2.2 - The Flying Pig Half-Marathon (13.1 miles) had...Ch. 2.3 - The following data are for 30 observations...Ch. 2.3 - The following observations are for two...Ch. 2.3 - The Daytona 500 is a 500-mile automobile race held...Ch. 2.3 - The following crosstabulation shows the average...Ch. 2.3 - Prob. 31ECh. 2.3 - The following crosstabulation shows the number of...Ch. 2.4 - Prob. 36ECh. 2.4 - Consider the following data on two categorical...Ch. 2.4 - Prob. 38ECh. 2.4 - Prob. 39ECh. 2.4 - Prob. 40ECh. 2.4 - Prob. 41ECh. 2.4 - Prob. 42ECh. 2.4 - The Northwest regional manager of an outdoor...Ch. 2 - Approximately 1.5 million high school students...Ch. 2 - Data showing the population by state in millions...Ch. 2 - A startup company's ability to gain funding is a...Ch. 2 - Prob. 49SECh. 2 - Prob. 50SECh. 2 - Western University has only one women's softball...Ch. 2 - Prob. 53SECh. 2 - Prob. 57SECh. 2 - A zoo has categorized its visitors into three...Ch. 2 - Pelican Stores, a division of National Clothing,...Ch. 2 - Prob. 2.1.2CPCh. 2 - Pelican Stores, a division of National Clothing,...Ch. 2 - Pelican Stores, a division of National Clothing,...Ch. 2 - Case Problem 2Motion Picture Industry The motion...Ch. 2 - Prob. 2.2.2CPCh. 2 - Case Problem 2 Motion Picture Industry The motion...Ch. 2 - Case Problem 2 Motion Picture Industry The motion...Ch. 2 - Case Problem 3Queen City Cincinnati, Ohio, also...Ch. 2 - Case Problem 3Queen City Cincinnati, Ohio, also...Ch. 2 - Case Problem 3Queen City Cincinnati, Ohio, also...Ch. 2 - Case Problem 4Cut-Rate Machining, Inc. Jon...Ch. 2 - Case Problem 4Cut-Rate Machining, Inc. Jon...Ch. 2 - Case Problem 4Cut-Rate Machining, Inc. Jon...
Knowledge Booster


Learn more about
Need a deep-dive on the concept behind this application? Look no further. Learn more about this topic, statistics and related others by exploring similar questions and additional content below.Similar questions
- Given are six observations taken for two variables: X: 8 7 10 11 11 12 y: 23 21 30 33 36 35 compute the correlation coefficient for these data. How much of the variation in Y values is explained in variations in X values?arrow_forwardDetermine the value of y for x = 2 , given the following data:arrow_forwardGiven the following data pairs (x, y): (1, 1.24), (2, 5.23), (3, 7.24), (4, 7.60), (5, 9.97), (6, 14.31), (7, 13.99),(8, 14.88), (9, 18.04), (10, 20.70). Find the regression equation A. y = 0.490 x - 0.053 B. y = 2.04 x C. y = 1.98 x + 0.436 D. y = 0.49 xarrow_forward
- For the following pairs of data points (10, 100), (8, 120), (5, 200), (4, 200), (10, 90), (7, 110) , and (6, 150) , the relationship between X and Y is A. Negative B. None c. Zero D.Positivearrow_forwardIn a given community, a survey was conducted to determine whether there is any relationship between the size of one’s yearly income x (in hundred thousands of pesos) and the size of one’s home y (in hundreds of square meters). The data were collected for 10 samples. x. Income 41.2 68.3 22.4 56.7 42.2 86.1 50.3 35.7 44.4 47.5 y, Home size 2.9 3.5 2.5 3.1 3.3 4 3.7 2.9 3 3.1 a.) Find the correlation coefficient r between income and home size b.) Determine the equation of the regression line of home size on c.) Determine the home size of a person with an annual income of Php 4,000,000.00arrow_forwardThe following observations are for two quantitative variables, x and y. Observation x y 1 28 72 2 17 99 3 52 58 4 79 34 5 37 60 6 71 22 7 37 77 8 27 85 9 64 45 10 53 47 Observation x y 11 13 98 12 84 21 13 59 32 14 17 81 15 70 34 16 47 64 17 35 68 18 62 67 19 30 39 20 43 28 (a) Develop a crosstabulation for the data, with x as the row variable and y as the column variable. For x use classes of 10–29, 30–49, and so on; for y use classes of 40–59, 60–79, and so on. y GrandTotal 20–39 40–59 60–79 80–99 x 10–29 30–49 50–69 70–90 Grand Total (b) Compute the row percentages. (Round your answers to one decimal place.) y GrandTotal 20–39 40–59 60–79 80–99 x 10–29 30–49 50–69 70–90 (c) Compute the column percentages. (Round your answers to one decimal place.) y 20–39 40–59 60–79 80–99 x…arrow_forward
- Given are five observations for two variables, x and y.x 3 12 6 20 14y 65 50 65 15 18a. Develop a scatter diagram for these data.b. Compute correlation between x and y variable.c. Develop the estimated regression equation by computing b0 and barrow_forwardThe following table gives information on the amount of sugar (in grams) and the calorie count in one serving of a sample of 13 varieties of Kellogg’s cereal.Picture Below a. Find the correlation coefficient. Blank 30 b. Find the equation of the regression line: y = Blank 31 + Blank 32x c. Calculate the predicted calorie count for a cereal with 16 grams of sugar per serving. Blank 33arrow_forwardGiven are five observations for two variables, x and y.x 3 12 6 20 14y 65 50 65 15 18a. Develop a scatter diagram for these data.b. Compute correlation between x and y variable.c. Develop the estimated regression equation by computing b0 and b1arrow_forward
arrow_back_ios
arrow_forward_ios
Recommended textbooks for you
 Algebra & Trigonometry with Analytic GeometryAlgebraISBN:9781133382119Author:SwokowskiPublisher:Cengage
 Functions and Change: A Modeling Approach to Coll...AlgebraISBN:9781337111348Author:Bruce Crauder, Benny Evans, Alan NoellPublisher:Cengage Learning
Algebra & Trigonometry with Analytic Geometry
Algebra
ISBN:9781133382119
Author:Swokowski
Publisher:Cengage
Functions and Change: A Modeling Approach to Coll...
Algebra
ISBN:9781337111348
Author:Bruce Crauder, Benny Evans, Alan Noell
Publisher:Cengage Learning
Correlation Vs Regression: Difference Between them with definition & Comparison Chart; Author: Key Differences;https://www.youtube.com/watch?v=Ou2QGSJVd0U;License: Standard YouTube License, CC-BY
Correlation and Regression: Concepts with Illustrative examples; Author: LEARN & APPLY : Lean and Six Sigma;https://www.youtube.com/watch?v=xTpHD5WLuoA;License: Standard YouTube License, CC-BY