Essentials of Modern Business Statistics with Microsoft Office Excel (Book Only)
7th Edition
ISBN: 9781337298353
Author: David R. Anderson, Dennis J. Sweeney, Thomas A. Williams
Publisher: South-Western College Pub
bartleby

Concept explainers

bartleby

Videos

Textbook Question
Book Icon
Chapter 2.3, Problem 32E

The following crosstabulation shows the number of households (100s) in each of the four regions of the United States and the number of households at each income level (U.S. Bureau website, August 2013Chapter 2.3, Problem 32E, The following crosstabulation shows the number of households (100s) in each of the four regions of
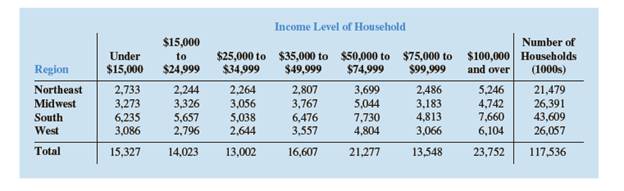
a. Compute the row percentages and identify the percent frequency distributions of income for households in each region.
b. What percentage of households in the West region have an income level of $50,000 or more? What percentage of households in the South region have an income level of $50,000 or more?
c. Construct percent frequency histograms for each region of households. Do any relationships between regions and income level appear to be evident in your findings?
d. Compute the column percentages. What information do the column percentages provide?
e. What percent of households with a household income of $100,000 and over are from the South region? What percentage of households from the South region have a household income of $100,000 and over? Why are these two percentages different?

Blurred answer

Chapter 2 Solutions

Essentials of Modern Business Statistics with Microsoft Office Excel (Book Only)

Ch. 2.2 - Consider the following data. a. Develop a...Ch. 2.2 - Consider the following frequency distribution...Ch. 2.2 - Prob. 13ECh. 2.2 - Prob. 14ECh. 2.2 - Prob. 15ECh. 2.2 - Construct a stem-and-leaf display for the...Ch. 2.2 - A doctor's office staff studied the waiting times...Ch. 2.2 - CBSSports.com developed the Total Player Ratings...Ch. 2.2 - Based on the tons handled in a year, the ports...Ch. 2.2 - The London School of Economics and the Harvard...Ch. 2.2 - Quantcast.com provides the number of people from...Ch. 2.2 - Entrepreneur magazine ranks franchises using...Ch. 2.2 - The following data show the year-to-date percent...Ch. 2.2 - Prob. 24ECh. 2.2 - Prob. 25ECh. 2.2 - The Flying Pig Half-Marathon (13.1 miles) had...Ch. 2.3 - The following data are for 30 observations...Ch. 2.3 - The following observations are for two...Ch. 2.3 - The Daytona 500 is a 500-mile automobile race held...Ch. 2.3 - The following crosstabulation shows the average...Ch. 2.3 - Prob. 31ECh. 2.3 - The following crosstabulation shows the number of...Ch. 2.4 - Prob. 36ECh. 2.4 - Consider the following data on two categorical...Ch. 2.4 - Prob. 38ECh. 2.4 - Prob. 39ECh. 2.4 - Prob. 40ECh. 2.4 - Prob. 41ECh. 2.4 - Prob. 42ECh. 2.4 - The Northwest regional manager of an outdoor...Ch. 2 - Approximately 1.5 million high school students...Ch. 2 - Data showing the population by state in millions...Ch. 2 - A startup company's ability to gain funding is a...Ch. 2 - Prob. 49SECh. 2 - Prob. 50SECh. 2 - Western University has only one women's softball...Ch. 2 - Prob. 53SECh. 2 - Prob. 57SECh. 2 - A zoo has categorized its visitors into three...Ch. 2 - Pelican Stores, a division of National Clothing,...Ch. 2 - Prob. 2.1.2CPCh. 2 - Pelican Stores, a division of National Clothing,...Ch. 2 - Pelican Stores, a division of National Clothing,...Ch. 2 - Case Problem 2Motion Picture Industry The motion...Ch. 2 - Prob. 2.2.2CPCh. 2 - Case Problem 2 Motion Picture Industry The motion...Ch. 2 - Case Problem 2 Motion Picture Industry The motion...Ch. 2 - Case Problem 3Queen City Cincinnati, Ohio, also...Ch. 2 - Case Problem 3Queen City Cincinnati, Ohio, also...Ch. 2 - Case Problem 3Queen City Cincinnati, Ohio, also...Ch. 2 - Case Problem 4Cut-Rate Machining, Inc. Jon...Ch. 2 - Case Problem 4Cut-Rate Machining, Inc. Jon...Ch. 2 - Case Problem 4Cut-Rate Machining, Inc. Jon...
Knowledge Booster
Background pattern image
Statistics
Learn more about
Need a deep-dive on the concept behind this application? Look no further. Learn more about this topic, statistics and related others by exploring similar questions and additional content below.
Recommended textbooks for you
Text book image
Glencoe Algebra 1, Student Edition, 9780079039897...
Algebra
ISBN:9780079039897
Author:Carter
Publisher:McGraw Hill
Text book image
Holt Mcdougal Larson Pre-algebra: Student Edition...
Algebra
ISBN:9780547587776
Author:HOLT MCDOUGAL
Publisher:HOLT MCDOUGAL
Mod-01 Lec-01 Discrete probability distributions (Part 1); Author: nptelhrd;https://www.youtube.com/watch?v=6x1pL9Yov1k;License: Standard YouTube License, CC-BY
Discrete Probability Distributions; Author: Learn Something;https://www.youtube.com/watch?v=m9U4UelWLFs;License: Standard YouTube License, CC-BY
Probability Distribution Functions (PMF, PDF, CDF); Author: zedstatistics;https://www.youtube.com/watch?v=YXLVjCKVP7U;License: Standard YouTube License, CC-BY
Discrete Distributions: Binomial, Poisson and Hypergeometric | Statistics for Data Science; Author: Dr. Bharatendra Rai;https://www.youtube.com/watch?v=lHhyy4JMigg;License: Standard Youtube License