Introduction to Probability and Statistics
14th Edition
ISBN: 9781133103752
Author: Mendenhall, William
Publisher: Cengage Learning
bartleby

Concept explainers

bartleby

Videos

Question
Book Icon
Chapter 2, Problem 2.55SE

a.

To determine

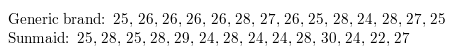
Find the five-number summary for the given data set.

a.

Expert Solution
Check Mark

Answer to Problem 2.55SE

For generic brand.

The minimum =24

  m=26

  QL=25

  QU=27.25

The maximum =28

  IQR=2.25

For Sunmaid.

The minimum =22

  m=26

  QL=24

  QU=28

The maximum =30

  IQR=4

Explanation of Solution

Given:

The given data set is

  Introduction to Probability and Statistics, Chapter 2, Problem 2.55SE , additional homework tip  1

Calculation:

For generic brand.

Arrange the data set from smallest to largest.

  25,25,25,26,26,26,26,26,27,27,28,28,28

Use five-number summary it consists of the minimum, the lower quartile, the median, the upper quartile and the maximum.

The minimum =25

The median = average of the two middle values (number of data values is even)n=14

  n= total number of data values.

  m=7thdata value+8thdata value2=26+262=522=26

For lower quartiles.

  0.25(n+1)=0.25(14+1)=3.75not an integer

The lower quartile is the 6th data value increased by 0.75 times the difference between the 3rd and the 4th data value.

  QL=25+0.75(2525)=25+0=25

For upper quartiles.

  0.75(n+1)=0.75(14+1)=11.25not an integer

The lower quartile is the 19th data value increased by 0.25 times the difference between the 11th and the 12th data value.

  QU=27+0.25(2827)=27+0.25=27.25

The maximum =28

  IQR=QUQL=27.2525=2.25

For Sunmaid.

Arrange the data set from smallest to largest.

  22,24,24,24,24,25,25,27,28,28,28,29,30

Use five-number summary it consists of the minimum, the lower quartile, the median, the upper quartile and the maximum.

The minimum =22

The median = average of the two middle values (number of data values is even)n=14

  n= total number of data values.

  m=7thdata value+8thdata value2=25+272=522=26

For lower quartiles.

  0.25(n+1)=0.25(14+1)=3.75not an integer

The lower quartile is the 6th data value increased by 0.75 times the difference between the 3rd and the 4th data value.

  QL=24+0.75(2424)=25+0=24

For upper quartiles.

  0.75(n+1)=0.75(14+1)=11.25not an integer

The lower quartile is the 19th data value increased by 0.25 times the difference between the 11th and the 12th data value.

  QU=28+0.25(2828)=28+0=28

The maximum =30

  IQR=QUQL=2824=4

b.

To determine

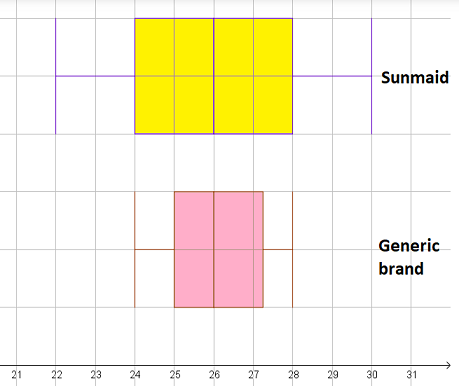
Draw two box plots on the same horizontal scale.

b.

Expert Solution
Check Mark

Answer to Problem 2.55SE

The boxplot is

  Introduction to Probability and Statistics, Chapter 2, Problem 2.55SE , additional homework tip  2

Explanation of Solution

Given:

The given data set is

  Introduction to Probability and Statistics, Chapter 2, Problem 2.55SE , additional homework tip  3

Calculation:

For generic brand.

Arrange the data set from smallest to largest.

  25,25,25,26,26,26,26,26,27,27,28,28,28

Use five-number summary it consists of the minimum, the lower quartile, the median, the upper quartile and the maximum.

The minimum =25

The median = average of the two middle values (number of data values is even)n=14

  n= total number of data values.

  m=7thdata value+8thdata value2=26+262=522=26

For lower quartiles.

  0.25(n+1)=0.25(14+1)=3.75not an integer

The lower quartile is the 6th data value increased by 0.75 times the difference between the 3rd and the 4th data value.

  QL=25+0.75(2525)=25+0=25

For upper quartiles.

  0.75(n+1)=0.75(14+1)=11.25not an integer

The lower quartile is the 19th data value increased by 0.25 times the difference between the 11th and the 12th data value.

  QU=27+0.25(2827)=27+0.25=27.25

The maximum =28

  IQR=QUQL=27.2525=2.25

Outliers it is an observation that are more than 1.5 times the IQR above QU or below QL .

  QU+1.5IQR=27.25+1.5(2.25)=30.625QL1.5IQR=251.5(2.25)=21.625

There are no outliers, because all data values are between 21.625 and 30.625 .

For Sunmaid.

Arrange the data set from smallest to largest.

  22,24,24,24,24,25,25,27,28,28,28,29,30

Use five-number summary it consists of the minimum, the lower quartile, the median, the upper quartile and the maximum.

The minimum =22

The median = average of the two middle values (number of data values is even)n=14

  n= total number of data values.

  m=7thdata value+8thdata value2=25+272=522=26

For lower quartiles.

  0.25(n+1)=0.25(14+1)=3.75not an integer

The lower quartile is the 6th data value increased by 0.75 times the difference between the 3rd and the 4th data value.

  QL=24+0.75(2424)=25+0=24

For upper quartiles.

  0.75(n+1)=0.75(14+1)=11.25not an integer

The lower quartile is the 19th data value increased by 0.25 times the difference between the 11th and the 12th data value.

  QU=28+0.25(2828)=28+0=28

The maximum =30

  IQR=QUQL=2824=4

Outliers it is an observation that are more than 1.5 times the IQR above QU or below QL .

  QU+1.5IQR=28+1.5(4)=34QL1.5IQR=241.5(4)=18

There are no outliers, because all data values are between 18 and 34 .

The boxplot starts at the lower quartile, ends at the upper quartile and vertical line at the median.

The whiskers of the boxplot are at the minimum and maximum value (excluding the outliers).

The box plot is

  Introduction to Probability and Statistics, Chapter 2, Problem 2.55SE , additional homework tip  4

c.

To determine

Draw a stem and leaf plots for the given data sets.

c.

Expert Solution
Check Mark

Answer to Problem 2.55SE

The shape of the distributions are symmetric and boxplots confirm the result.

Explanation of Solution

Given:

The given data set is

  Introduction to Probability and Statistics, Chapter 2, Problem 2.55SE , additional homework tip  5

Calculation:

For generic brand.

Arrange the data set from smallest to largest.

  25,25,25,26,26,26,26,26,27,27,28,28,28

Placethe digits of the ones to the left of the vertical line and the digits of the tenths of every data value to the right of the vertical line.

    Stem Leaf
    24252627280000000000000

For Sunmaid.

Arrange the data set from smallest to largest.

  22,24,24,24,24,25,25,27,28,28,28,29,30

Placethe digits of the ones to the left of the vertical line and the digits of the tenths of every data value to the right of the vertical line.

    Stem Leaf
    22232425262728293000000000000000

Both distributionsare symmetric, because most of the data values lie in the middle of the distribution.

The boxplots also confirms that the distribution is symmetric, because the box of the boxplot lies in the middle between the whiskers.

d.

To determine

Check the result for the average number of raisins for the two brands.

d.

Expert Solution
Check Mark

Answer to Problem 2.55SE

The two brands appear to have the same average number of raisins.

Explanation of Solution

Given:

The given data set is

  Introduction to Probability and Statistics, Chapter 2, Problem 2.55SE , additional homework tip  6

Calculation:

For generic brand.

Arrange the data set from smallest to largest.

  25,25,25,26,26,26,26,26,27,27,28,28,28

Use five-number summary it consists of the minimum, the lower quartile, the median, the upper quartile and the maximum.

The minimum =25

The median = average of the two middle values (number of data values is even)n=14

  n= total number of data values.

  m=7thdata value+8thdata value2=26+262=522=26

For Sunmaid.

Arrange the data set from smallest to largest.

  22,24,24,24,24,25,25,27,28,28,28,29,30

Use five-number summary it consists of the minimum, the lower quartile, the median, the upper quartile and the maximum.

The minimum =22

The median = average of the two middle values (number of data values is even)n=14

  n= total number of data values.

  m=7thdata value+8thdata value2=25+272=522=26

The median of both the brands are identical, the two brands appear to have the same average number of raisins.

Want to see more full solutions like this?

Subscribe now to access step-by-step solutions to millions of textbook problems written by subject matter experts!

Chapter 2 Solutions

Introduction to Probability and Statistics

Ch. 2.2 - Prob. 2.11ECh. 2.2 - Prob. 2.12ECh. 2.3 - You are given n=5 measurements: 2, 1, 1,3,5. a....Ch. 2.3 - Prob. 2.14ECh. 2.3 - Prob. 2.15ECh. 2.3 - Prob. 2.16ECh. 2.3 - Prob. 2.17ECh. 2.3 - Utility Bills in Southern CaliforniaThe monthly...Ch. 2.5 - Prob. 2.19ECh. 2.5 - Prob. 2.20ECh. 2.5 - A distribution of measurements is relatively...Ch. 2.5 - Prob. 2.22ECh. 2.5 - Prob. 2.23ECh. 2.5 - Packaging Hamburger Meat The data listed here are...Ch. 2.5 - Breathing Rates Is your breathing rate normal?...Ch. 2.5 - Prob. 2.26ECh. 2.5 - Social Security Numbers A group of70 students were...Ch. 2.5 - Prob. 2.28ECh. 2.5 - Prob. 2.29ECh. 2.5 - Prob. 2.30ECh. 2.5 - Timber Tracts To estimate the amount of lumber in...Ch. 2.5 - Prob. 2.32ECh. 2.5 - Prob. 2.33ECh. 2.5 - Prob. 2.34ECh. 2.5 - Prob. 2.35ECh. 2.5 - Prob. 2.36ECh. 2.5 - Prob. 2.37ECh. 2.5 - Prob. 2.38ECh. 2.5 - Prob. 2.39ECh. 2.7 - Prob. 2.40ECh. 2.7 - Find the five-number summary and the IQR forthese...Ch. 2.7 - Given the following data set: 2.3, 1.0, 2.1, 6.5,...Ch. 2.7 - Given the following data set: .23, .30, .35, .41,...Ch. 2.7 - Construct a box plot for these data and...Ch. 2.7 - Construct a box plot for these data and...Ch. 2.7 - If you scored at the 69th percentile on a...Ch. 2.7 - Mercury Concentration in DolphinsEnvironmental...Ch. 2.7 - Hamburger Meat The weights (in pounds) of the 27...Ch. 2.7 - Comparing NFL Quarterbacks How does Aaron Rodgers,...Ch. 2.7 - Presidential Vetoes The set of presidential vetoes...Ch. 2.7 - Survival Times Altman and Bland report the...Ch. 2.7 - Utility Bills in Southern California, again The...Ch. 2.7 - What’s Normal? again Refer to Exercise1.67 and...Ch. 2 - Raisins The number of raisins in each of...Ch. 2 - Prob. 2.55SECh. 2 - Prob. 2.56SECh. 2 - A Recurring IIIness Refer to Exercise 1.26 and...Ch. 2 - Prob. 2.58SECh. 2 - Prob. 2.59SECh. 2 - Tuna Fish, again Refer to Exercise 2.8. Theprices...Ch. 2 - Prob. 2.61SECh. 2 - Chloroform According to the EPA, Chloroform, which...Ch. 2 - Prob. 2.63SECh. 2 - Sleep and the College Student How muchsleep do you...Ch. 2 - Prob. 2.65SECh. 2 - Prob. 2.66SECh. 2 - Polluted Seawater Petroleum pollution in seasand...Ch. 2 - Prob. 2.68SECh. 2 - Prob. 2.69SECh. 2 - Prob. 2.70SECh. 2 - Prob. 2.71SECh. 2 - Prob. 2.72SECh. 2 - Prob. 2.73SECh. 2 - Prob. 2.74SECh. 2 - TV Commercials The mean duration oftelevision...Ch. 2 - Prob. 2.76SECh. 2 - Prob. 2.77SECh. 2 - Prob. 2.78SECh. 2 - Prob. 2.79SECh. 2 - Prob. 2.80SECh. 2 - Prob. 2.81SECh. 2 - Prob. 2.82SECh. 2 - Prob. 2.83SECh. 2 - Prob. 2.84SECh. 2 - Prob. 2.85SE
Knowledge Booster
Background pattern image
Statistics
Learn more about
Need a deep-dive on the concept behind this application? Look no further. Learn more about this topic, statistics and related others by exploring similar questions and additional content below.
Recommended textbooks for you
Text book image
Glencoe Algebra 1, Student Edition, 9780079039897...
Algebra
ISBN:9780079039897
Author:Carter
Publisher:McGraw Hill
Text book image
Big Ideas Math A Bridge To Success Algebra 1: Stu...
Algebra
ISBN:9781680331141
Author:HOUGHTON MIFFLIN HARCOURT
Publisher:Houghton Mifflin Harcourt
Text book image
Holt Mcdougal Larson Pre-algebra: Student Edition...
Algebra
ISBN:9780547587776
Author:HOLT MCDOUGAL
Publisher:HOLT MCDOUGAL
The Shape of Data: Distributions: Crash Course Statistics #7; Author: CrashCourse;https://www.youtube.com/watch?v=bPFNxD3Yg6U;License: Standard YouTube License, CC-BY
Shape, Center, and Spread - Module 20.2 (Part 1); Author: Mrmathblog;https://www.youtube.com/watch?v=COaid7O_Gag;License: Standard YouTube License, CC-BY
Shape, Center and Spread; Author: Emily Murdock;https://www.youtube.com/watch?v=_YyW0DSCzpM;License: Standard Youtube License