
Concept explainers
Videos
a.
Find the
a.
Answer to Problem 2.65SE
The range is
Explanation of Solution
Given:
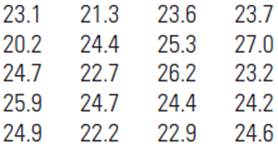
The data shows that the miles per gallon for each of twenty medium sized cars.

Calculation:
Arrange the data values from smallest to largest.
The minimum value
The maximum value
Range
Range
Hence the range is
b.
Draw a relative frequency histogram.
b.
Answer to Problem 2.65SE
The standard deviation
Explanation of Solution
Given:
The data shows that the miles per gallon for each of twenty medium sized cars.
Calculation:
Arrange the data values from smallest to largest.
Draw a relative frequency table.
| Class | Frequency | Relative frequency |
The histogram is
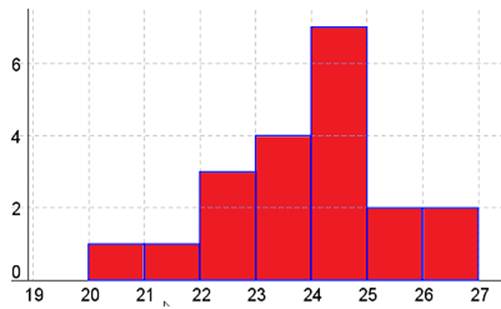
The width of the bars has to be the same.
The height of the bars has to be equal to the relative frequency.
The distribution is slightly skewed left, because highest bar is right and tail of smaller bars to the left in histogram.
c.
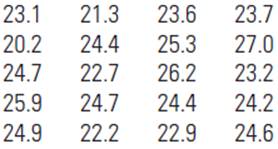
Find the mean and the standard deviation for the given data.
c.
Answer to Problem 2.65SE
The value of mean
Explanation of Solution
Given:
The data shows that the miles per gallon for each of twenty medium sized cars.
Calculation:
Arrange the data values from smallest to largest.
find the sample variance
Hence the value of mean
d.
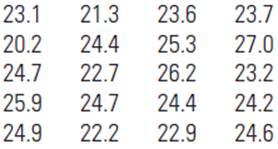
Find the median for the given data set.
d.
Answer to Problem 2.65SE
The median is
Explanation of Solution
Given:
The data shows that the miles per gallon for each of twenty medium sized cars.
Calculation:
Arrange the data values from smallest to largest.
The median
Hence the median is
e.
Find the lower and upper
e.
Answer to Problem 2.65SE
The lower quartile is
Explanation of Solution
Given:
The data shows that the miles per gallon for each of twenty medium sized cars.

Calculation:
Arrange the data values from smallest to largest.
Use five-number summary
The minimum
The median
For lower quartiles.
The lower quartile is the
For upper quartiles.
The lower quartile is the
Hence the lower quartile is
Want to see more full solutions like this?
Chapter 2 Solutions
Introduction to Probability and Statistics


 Glencoe Algebra 1, Student Edition, 9780079039897...AlgebraISBN:9780079039897Author:CarterPublisher:McGraw Hill