
Introduction to Probability and Statistics
14th Edition
ISBN: 9781133103752
Author: Mendenhall, William
Publisher: Cengage Learning
expand_more
expand_more
format_list_bulleted
Concept explainers
Videos
Textbook Question
Chapter 2.5, Problem 2.24E
Packaging Hamburger Meat The data listed here are the weights (in pounds) of27 packages of ground beef in a supermarket meatdisplay: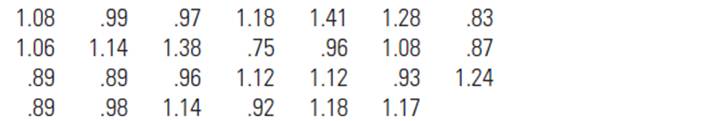
- Construct a stem and leaf plot or a relativefrequency histogram to display the distribution ofweights. Is the distribution relatively mound- shaped?
- Find the mean and standard deviation of the dataset.
- Find the percentage of measurements in the intervals
- How do the percentages obtained in part c comparewith those given by the
Empirical Rule ? Explain. - How many of the packages weigh exactly I pound’?Can you think of any explanation for this?
Expert Solution & Answer
Want to see the full answer?
Check out a sample textbook solution
Chapter 2 Solutions
Introduction to Probability and Statistics
Ch. 2.2 - You are given n=5 measurements: 0, 5, 1, 1,3. Draw...Ch. 2.2 - Prob. 2.2ECh. 2.2 - Prob. 2.3ECh. 2.2 - Auto Insurance The cost of automobile insurance...Ch. 2.2 - Prob. 2.5ECh. 2.2 - Prob. 2.6ECh. 2.2 - Prob. 2.7ECh. 2.2 - Prob. 2.8ECh. 2.2 - Prob. 2.9ECh. 2.2 - Prob. 2.10E
Ch. 2.2 - Prob. 2.11ECh. 2.2 - Prob. 2.12ECh. 2.3 - You are given n=5 measurements: 2, 1, 1,3,5. a....Ch. 2.3 - Prob. 2.14ECh. 2.3 - Prob. 2.15ECh. 2.3 - Prob. 2.16ECh. 2.3 - Prob. 2.17ECh. 2.3 - Utility Bills in Southern CaliforniaThe monthly...Ch. 2.5 - Prob. 2.19ECh. 2.5 - Prob. 2.20ECh. 2.5 - A distribution of measurements is relatively...Ch. 2.5 - Prob. 2.22ECh. 2.5 - Prob. 2.23ECh. 2.5 - Packaging Hamburger Meat The data listed here are...Ch. 2.5 - Breathing Rates Is your breathing rate normal?...Ch. 2.5 - Prob. 2.26ECh. 2.5 - Social Security Numbers A group of70 students were...Ch. 2.5 - Prob. 2.28ECh. 2.5 - Prob. 2.29ECh. 2.5 - Prob. 2.30ECh. 2.5 - Timber Tracts To estimate the amount of lumber in...Ch. 2.5 - Prob. 2.32ECh. 2.5 - Prob. 2.33ECh. 2.5 - Prob. 2.34ECh. 2.5 - Prob. 2.35ECh. 2.5 - Prob. 2.36ECh. 2.5 - Prob. 2.37ECh. 2.5 - Prob. 2.38ECh. 2.5 - Prob. 2.39ECh. 2.7 - Prob. 2.40ECh. 2.7 - Find the five-number summary and the IQR forthese...Ch. 2.7 - Given the following data set: 2.3, 1.0, 2.1, 6.5,...Ch. 2.7 - Given the following data set: .23, .30, .35, .41,...Ch. 2.7 - Construct a box plot for these data and...Ch. 2.7 - Construct a box plot for these data and...Ch. 2.7 - If you scored at the 69th percentile on a...Ch. 2.7 - Mercury Concentration in DolphinsEnvironmental...Ch. 2.7 - Hamburger Meat The weights (in pounds) of the 27...Ch. 2.7 - Comparing NFL Quarterbacks How does Aaron Rodgers,...Ch. 2.7 - Presidential Vetoes The set of presidential vetoes...Ch. 2.7 - Survival Times Altman and Bland report the...Ch. 2.7 - Utility Bills in Southern California, again The...Ch. 2.7 - What’s Normal? again Refer to Exercise1.67 and...Ch. 2 - Raisins The number of raisins in each of...Ch. 2 - Prob. 2.55SECh. 2 - Prob. 2.56SECh. 2 - A Recurring IIIness Refer to Exercise 1.26 and...Ch. 2 - Prob. 2.58SECh. 2 - Prob. 2.59SECh. 2 - Tuna Fish, again Refer to Exercise 2.8. Theprices...Ch. 2 - Prob. 2.61SECh. 2 - Chloroform According to the EPA, Chloroform, which...Ch. 2 - Prob. 2.63SECh. 2 - Sleep and the College Student How muchsleep do you...Ch. 2 - Prob. 2.65SECh. 2 - Prob. 2.66SECh. 2 - Polluted Seawater Petroleum pollution in seasand...Ch. 2 - Prob. 2.68SECh. 2 - Prob. 2.69SECh. 2 - Prob. 2.70SECh. 2 - Prob. 2.71SECh. 2 - Prob. 2.72SECh. 2 - Prob. 2.73SECh. 2 - Prob. 2.74SECh. 2 - TV Commercials The mean duration oftelevision...Ch. 2 - Prob. 2.76SECh. 2 - Prob. 2.77SECh. 2 - Prob. 2.78SECh. 2 - Prob. 2.79SECh. 2 - Prob. 2.80SECh. 2 - Prob. 2.81SECh. 2 - Prob. 2.82SECh. 2 - Prob. 2.83SECh. 2 - Prob. 2.84SECh. 2 - Prob. 2.85SE
Knowledge Booster


Learn more about
Need a deep-dive on the concept behind this application? Look no further. Learn more about this topic, statistics and related others by exploring similar questions and additional content below.Recommended textbooks for you
 MATLAB: An Introduction with ApplicationsStatisticsISBN:9781119256830Author:Amos GilatPublisher:John Wiley & Sons Inc
 Probability and Statistics for Engineering and th...StatisticsISBN:9781305251809Author:Jay L. DevorePublisher:Cengage Learning
 Statistics for The Behavioral Sciences (MindTap C...StatisticsISBN:9781305504912Author:Frederick J Gravetter, Larry B. WallnauPublisher:Cengage Learning
 Elementary Statistics: Picturing the World (7th E...StatisticsISBN:9780134683416Author:Ron Larson, Betsy FarberPublisher:PEARSON
 The Basic Practice of StatisticsStatisticsISBN:9781319042578Author:David S. Moore, William I. Notz, Michael A. FlignerPublisher:W. H. Freeman
 Introduction to the Practice of StatisticsStatisticsISBN:9781319013387Author:David S. Moore, George P. McCabe, Bruce A. CraigPublisher:W. H. Freeman
MATLAB: An Introduction with Applications
Statistics
ISBN:9781119256830
Author:Amos Gilat
Publisher:John Wiley & Sons Inc
Probability and Statistics for Engineering and th...
Statistics
ISBN:9781305251809
Author:Jay L. Devore
Publisher:Cengage Learning
Statistics for The Behavioral Sciences (MindTap C...
Statistics
ISBN:9781305504912
Author:Frederick J Gravetter, Larry B. Wallnau
Publisher:Cengage Learning
Elementary Statistics: Picturing the World (7th E...
Statistics
ISBN:9780134683416
Author:Ron Larson, Betsy Farber
Publisher:PEARSON
The Basic Practice of Statistics
Statistics
ISBN:9781319042578
Author:David S. Moore, William I. Notz, Michael A. Fligner
Publisher:W. H. Freeman
Introduction to the Practice of Statistics
Statistics
ISBN:9781319013387
Author:David S. Moore, George P. McCabe, Bruce A. Craig
Publisher:W. H. Freeman
Statistics 4.1 Point Estimators; Author: Dr. Jack L. Jackson II;https://www.youtube.com/watch?v=2MrI0J8XCEE;License: Standard YouTube License, CC-BY
Statistics 101: Point Estimators; Author: Brandon Foltz;https://www.youtube.com/watch?v=4v41z3HwLaM;License: Standard YouTube License, CC-BY
Central limit theorem; Author: 365 Data Science;https://www.youtube.com/watch?v=b5xQmk9veZ4;License: Standard YouTube License, CC-BY
Point Estimate Definition & Example; Author: Prof. Essa;https://www.youtube.com/watch?v=OTVwtvQmSn0;License: Standard Youtube License
Point Estimation; Author: Vamsidhar Ambatipudi;https://www.youtube.com/watch?v=flqhlM2bZWc;License: Standard Youtube License