
PRINCIPLES OF GEOTECH.ENGINEERING >LL+M
9th Edition
ISBN: 9781337583879
Author: Das
Publisher: CENGAGE L
expand_more
expand_more
format_list_bulleted
Concept explainers
Videos
Textbook Question
Chapter 2, Problem 2.7P
Repeat Problem 2.4 with the following data.
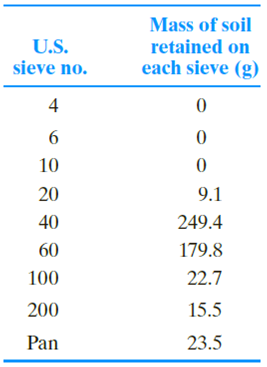
2.4 The following are the results of a sieve analysis.
a. Determine the percent finer than each sieve and plot a grain-size distribution curve.
b. Determine D10, D30, and D60 for each soil.
c. Calculate the uniformity coefficient Cu.
d. Calculate the coefficient of gradation Cc.
Expert Solution & Answer

Trending nowThis is a popular solution!

Students have asked these similar questions
8. a) According to the results of a sieve analysis in Table 1 below, plot the sieve analysis graph and construct a soil particle-size distribution curve.
Table 1
Sieve Size (mm)
Mass of retained (g)
4.75
0
2.00
40
0.850
60
0.425
89
0.250
140
0.180
122
0.150
210
0.075
56
Pan
12
b) Determine i)Effective size D10, D30, and D60 ii)Uniformity coefficient, Cu iii)Coefficient of curvature, Cc iv)Classify the soil based on the graph
U.S Sieve No
Opening (mm)
Mass of soil retained (g)
4
4.75
28
10
2.00
42
20
0.85
48
40
0.425
128
60
0.250
221
100
0.150
86
200
0.075
40
Pan
24
Determine the percent finer than each sieve and plot a grain-size distribution curve.
Determine D10, D30, and D60 from the grain-size distribution curve.
Calculate the uniformity coefficient, Cu.
Calculate the coefficient of gradation, Cc.
Classify the soil by AASHTO and USCS system. (LL = 30, PL = 10)
Given below is the result of a sieve analysis done on a soil sample. Determine the value of the coefficient of uniformity. Round off th three decimal places.
Chapter 2 Solutions
PRINCIPLES OF GEOTECH.ENGINEERING >LL+M
Ch. 2 - For a gravel with D60 = 0.48 mm, D30 = 0.25 mm,...Ch. 2 - Prob. 2.2PCh. 2 - Prob. 2.3PCh. 2 - The following are the results of a sieve analysis....Ch. 2 - Repeat Problem 2.4 with the following data. 2.4...Ch. 2 - Repeat Problem 2.4 with the following data. 2.4...Ch. 2 - Repeat Problem 2.4 with the following data. 2.4...Ch. 2 - The following are the results of a sieve and...Ch. 2 - Repeat Problem 2.8 using the following data. 2.8...Ch. 2 - Repeat Problem 2.8 using the following data. 2.8...
Ch. 2 - The grain-size characteristics of a soil are given...Ch. 2 - Repeat Problem 2.11 with the following data. 2.11...Ch. 2 - Repeat Problem 2.11 with the following data. 2.11...Ch. 2 - A hydrometer test has the following result: Gs =...Ch. 2 - Repeat Problem 2.14 with the following values: Gs...Ch. 2 - Three groups of students from the Geotechnical...Ch. 2 - Refer to Problem 2.C.1. Results of the sieve...
Knowledge Booster


Learn more about
Need a deep-dive on the concept behind this application? Look no further. Learn more about this topic, civil-engineering and related others by exploring similar questions and additional content below.Similar questions
- Repeat Problem 2.4 with the following data. 2.4 The following are the results of a sieve analysis. a. Determine the percent finer than each sieve and plot a grain-size distribution curve. b. Determine D10, D30, and D60 for each soil. c. Calculate the uniformity coefficient Cu. d. Calculate the coefficient of gradation Cc.arrow_forwardRepeat Problem 2.8 using the following data. 2.8 The following are the results of a sieve and hydrometer analysis. a. Draw the grain-size distribution curve. b. Determine the percentages of gravel, sand, silt and clay according to the MIT system. c. Repeat Part b according to the USDA system. d. Repeat Part b according to the AASHTO system.arrow_forwardConsidering the following measurements, calculate the quantity passing and % retained applicable for sieve number 4. Total soil mass used in a sieve analysis test is 500 g Mass retained on No. 4 sieve = 9.7 garrow_forward
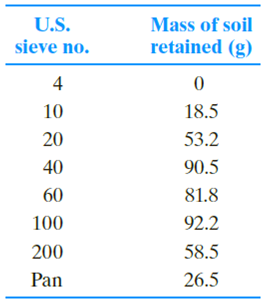
- The table shows the laboratory results of the sieve analysis of a sample. Plot the grain size curve of the soil. The soil has a liquid limit of 35% and plasticity index of 26%. SIEVE SIZE (mm) WEIGHT RETAINED 0.25 18.96 0.149 33.18 0.074 45.03 0.052 54.51 0.02 42.66 0.01 11.85 0.004 4.74 0.001 4.74 Pan 21.33 a.) Classify the soil using AASHTO method b.) Classify the soil using USCS method c.) Classify the soil using USDA method Please answer this asap. For upvote. Thank you in advancearrow_forwardLet us assume that a soil sample taken in the field is taken and it must be identified by the SUCS Method and AASHTO Method. Moisture content = 5.75% Limit liquid = 53.5 Plastic limit = 31.6 Granulometry Sieve % Pass No. 4 100 # 40 68 # 200 54.3 Do you select the best answer? a) Inorganic silt and sand, with low plasticity b) Inorganic clay with low plasticity c) Clay silt, traces of gravel, dark Brownarrow_forwardQUESTION 2 a. The results given in Table 1 were obtained in a particle size distribution test for soil sample received in the laboratory. Table 1 US Sieve No. Size Opening(mm) Weight Retained(g) 4 4.75 0 10 2.0 18.5 20 0.85 53.2 40 0.425 90.5 60 0.25 81.8 100 0.150 92.2 200 0.075 58.5 Pan - 26.5i. Determine the percentage passing each sieve and plot the particle size distribution curve. ii. How much fine-grained soils are in the sample ? iii. Determine the amount of gravel and sand in the sample ? iv. Determine D10, D30, and D60 from the grain-size distribution curve. v. Calculate the uniformity coefficient, Cu. vi. Calculate the coefficient of gradation, Cc. vii. Describe the gradation curve (eg poorly graded)arrow_forward
- The following are the results of a sieve and hydrometer analysis. Draw the grain -size distribution curve Determine the percentages of gravel, sand silt and clay. UC, CC and S Classify the soil according to USDA. Classify the soil according to ASHTOO. X=1.6 y=2.8arrow_forwardQ 05: (CLO 3) For a given soil, the following are given in Table: Specific Gravity Gs, bulk unit weight γ), and moisture content (w). Use data from the table according to your registration number. (You can solve answer on paper and paste neat clear image in the answer). Student Registration Number Gs γ (kN/m3) moisture content (w) % 102 2.72 17.2 20 Determine: Dry unit weight Void ratio Porosity Degree of saturationarrow_forwardWith the aid of a diagram, explain how sieve analysis is conducted to determine the particle size distributions of soilarrow_forward
- The following results were obtained by a mechanical sieve analysis. classify the soil using the Unified Soil Classification System. Sieve analysis % passing by weight is as follows: No.4 = 100% No. 40 = 70% No.200 = 30% Liquid Limit= 33 Plastic Limit = 12arrow_forward12. Situation 12 - The given data shows the sieve analysis of three soil samples. a. Compute for the group index of Soil B. b Compute for the group index of Soil A. c. Compute for the group index of Soil Carrow_forwardRefer to the soil in Problem 4.5. Using the Casagrande plasticity chart, graphically estimate the shrinkage limit of the soil as shown in Figure 4.22. 4.5 The following data were obtained by conducting liquid limit and plastic limit tests on a soil collected from the site. Liquid limit tests: Plastic limit test: PL = 19.3% a. Draw the flow curve and determine the liquid limit. b. Using the Casagrande plasticity chart (Figure 4.21), determine the soil type.arrow_forward
arrow_back_ios
SEE MORE QUESTIONS
arrow_forward_ios
Recommended textbooks for you
 Principles of Geotechnical Engineering (MindTap C...Civil EngineeringISBN:9781305970939Author:Braja M. Das, Khaled SobhanPublisher:Cengage Learning
 Fundamentals of Geotechnical Engineering (MindTap...Civil EngineeringISBN:9781305635180Author:Braja M. Das, Nagaratnam SivakuganPublisher:Cengage Learning
 Principles of Foundation Engineering (MindTap Cou...Civil EngineeringISBN:9781337705028Author:Braja M. Das, Nagaratnam SivakuganPublisher:Cengage Learning
Principles of Geotechnical Engineering (MindTap C...
Civil Engineering
ISBN:9781305970939
Author:Braja M. Das, Khaled Sobhan
Publisher:Cengage Learning
Fundamentals of Geotechnical Engineering (MindTap...
Civil Engineering
ISBN:9781305635180
Author:Braja M. Das, Nagaratnam Sivakugan
Publisher:Cengage Learning
Principles of Foundation Engineering (MindTap Cou...
Civil Engineering
ISBN:9781337705028
Author:Braja M. Das, Nagaratnam Sivakugan
Publisher:Cengage Learning
How Are Highways Designed?; Author: Practical Engineering;https://www.youtube.com/watch?v=9XIjqdk69O4;License: Standard Youtube License