![WebAssign for Rosner's Fundamentals of Biostatistics, 8th Edition [Instant Access], Single-Term](https://s3.amazonaws.com/compass-isbn-assets/textbook_empty_images/large_textbook_empty.svg)
Videos
Activated-protein-C (APC) resistance is a serum marker that has been associated with thrombosis (the formation of blood clots often leading to heart attacks) among adults. A study assessed this risk factor among adolescents. To assess the reproducibility of the assay, a split-sample technique was used in which a blood sample was provided by 10 people; each sample was split into two aliquots (sub-samples), and each aliquot was assessed separately. Table 2.19 gives the results.
Table 2.19 APC resistance split-samples data
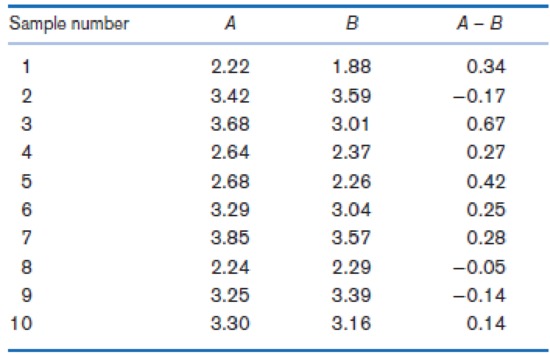
To assess the variability of the assay, the investigators need to compute the coefficient of variation. Compute the coefficient of variation (CV) for each subject by obtaining the
Want to see the full answer?
Check out a sample textbook solution
Chapter 2 Solutions
WebAssign for Rosner's Fundamentals of Biostatistics, 8th Edition [Instant Access], Single-Term


- A study was undertaken to investigate the effectiveness of an aquarobic exercise program for patients with osteoarthritis. A convenience sample of 70 individuals with arthritis was selected, and each person was randomly assigned to one of two groups. The first group participated in a weekly aquarobic exercise program for 8 weeks; the second group served as a control. Several pieces of data were collected from the individuals, including their total cholesterol (mg). Determine if there is a significant difference in the mean cholesterol for the two groups (aquarobic & control) at the start of the study using a significance level of 0.01. Difference Sample Diff. Std. Error df Aquarobic - Control -13.9045 6.8214 67.8635 What hypotheses should be tested? Make sure to select the hypotheses which are written with notation consistent with the type of samples selected. Ho:μd=0Ho:μd=0Ha:μd>0Ha:μd>0 Ho:μd=0Ho:μd=0Ha:μd<0Ha:μd<0 Ho:μ1=μ2Ho:μ1=μ2Ha:μ1<μ2Ha:μ1<μ2…arrow_forwardThe Paleo diet allows only for foods that humans typically consumed over the last 2.5 million years, excluding those agriculture-type foods that arose during the last 10,000 years or so. Researchers randomly divided 500 volunteers into two equal-sized groups. One group spent 6 months on the Paleo diet. The other group received a pamphlet about controlling portion sizes. A randomized treatment assignment was performed, and at the beginning of the study, the average difference in weights between the two groups was about 0 pounds. After the study, the Paleo group had lost an average of 7.1 pounds with a standard deviation of 22.75 pounds while the control group had lost an average of 4.5 pounds with a standard deviation of 11.5 pounds. After failing to reject the null hypothesis support your answer with a p-value (a) P-value = _______arrow_forwardThe Paleo diet allows only for foods that humans typically consumed over the last 2.5 million years, excluding those agriculture-type foods that arose during the last 10,000 years or so. Researchers randomly divided 500 volunteers into two equal-sized groups. One group spent 6 months on the Paleo diet. The other group received a pamphlet about controlling portion sizes. A randomized treatment assignment was performed, and at the beginning of the study, the average difference in weights between the two groups was about 0 pounds. After the study, the Paleo group had lost an average of 6.5 pounds with a standard deviation of 22.75 pounds while the control group had lost an average of 5.2 pounds with a standard deviation of 10.25 pounds. 95% Confidence Interval ( -1.808, 4.408 ) What is the P-Value? _______arrow_forward
- Lester Hollar is vice president for human resources for a large manufacturing company. In recent years, he has noticed an increase in absenteeism that he thinks is related to the general health of the employees. Four years ago, in an attempt to improve the situation, he began a fitness program in which employees exercise during their lunch hour. To evaluate the program, he selected a random sample of eight participants and found the number of days each was absent in the six months before the exercise program began and in the six months following the exercise program. Below are the results. Employee Before After 7 6. 7. 4 6 4. 5 6 7 8. I Click here for the Excel Data File At the 0.100 significance level, can he conclude that the number of absences has declined? Estimate the p-value.arrow_forwardLester Hollar is vice president for human resources for a large manufacturing company. In recent years, he has noticed an increase in absenteeism that he thinks is related to the general health of the employees. Four years ago, in an attempt to improve the situation, he began a fitness program in which employees exercise during their lunch hour. To evaluate the program, he selected a random sample of eight participants and found the number of days each was absent in the six months before the exercise program began and in the six months following the exercise program. Below are the results. Employee Before After 1 6 5 2 6 2 3 7 1 4 7 3 5 4 3 6 3 6 7 5 3 8 6 7 At the 0.05 significance level, can he conclude that the number of absences has declined? Estimate the p-value. State the decision rule for 0.05 significance level. (Round your answer to 3 decimal places.) 2. Compute the test statistic. (Round your answer to 3 decimal places.) 3. The…arrow_forwardLester Hollar is vice president for human resources for a large manufacturing company. In recent years, he has noticed an increase in absenteeism that he thinks is related to the general health of the employees. Four years ago, in an attempt to improve the situation, he began a fitness program in which employees exercise during their lunch hour. To evaluate the program, he selected a random sample of eight participants and found the number of days each was absent in the six months before the exercise program began and in the six months following the exercise program. Below are the results. Employee Before After 1 5 5 2 5 3 3 6 3 4 5 2 5 4 2 6 7 6 7 5 4 8 5 7 Click here for the Excel Data File At the 0.010 significance level, can he conclude that the number of absences has declined? Estimate the p-value. State the decision rule for 0.010 significance level. (Round your answer to 3 decimal places.) Compute the test statistic. (Round…arrow_forward
- Lester Hollar is vice president for human resources for a large manufacturing company. In recent years, he has noticed an increase in absenteeism that he thinks is related to the general health of the employees. Four years ago, in an attempt to improve the situation, he began a fitness program in which employees exercise during their lunch hour. To evaluate the program, he selected a random sample of eight participants and found the number of days each was absent in the six months before the exercise program began and in the six months following the exercise program. Below are the results. Employee Before After Bauman 6 2 Briggs 5 6 Dottellis 5 3 Lee 7 7 Perralt 4 6 Rielly 5 2 Steinmetz 7 3 Stoltz 5 4 At the 0.050 significance level, can he conclude that the number of absences has declined? Estimate the p-value. a. State the decision rule for 0.050 significance level. b. Compute the test statistic c. The p-value is d. State your decision about the null hypothesis.arrow_forwardLester Hollar is vice president for human resources for a large manufacturing company. In recent years, he has noticed an increase in absenteeism that he thinks is related to the general health of the employees. Four years ago, in an attempt to improve the situation, he began a fitness program in which employees exercise during their lunch hour. To evaluate the program, he selected a random sample of eight participants and found the number of days each was absent in the six months before the exercise program began and in the six months following the exercise program. Below are the results. Employee Before After 1 5 2 3 3 7 4. 6. 2 8 S Click here for the Excel Data File At the 0.100 significance level, can he conclude that the number of absences has declined? Estimate the p-value. a. State the decision rule for 0.100 significance level. (Round your answer to 3 decimal places.) Reject HO if t > b. Compute the test statistic. (Round your answer to 3 decimal places.) The test statistic isarrow_forwardCalcium and Blood Pressure Does increasing the amount of calcium in our diet reduce blood pressure? Examination of a large sample of people revealed a relationship between calcium intake and blood pressure. Such observational studies do not establish causation. Researchers therefore designed a randomized comparative experiment. The subjects were 21 healthy men who volunteered to take part in the experiment. They were randomly assigned to two groups: 10 of the men received a calcium supplement for 12 weeks, while the control group of 11 men received a placebo pill that looked identical. The experiment was double-blind. The response variable is the decrease in systolic (top number) blood pressure for a subject after 12 weeks, in millimeters of mercury. An increase appears as a negative number. Do the data provide convincing evidence that a calcium supplement reduces blood pressure more than a placebo, on average, for subjects like the ones in this study? Group 1 (calcium) Group (placebo)…arrow_forward
 Holt Mcdougal Larson Pre-algebra: Student Edition...AlgebraISBN:9780547587776Author:HOLT MCDOUGALPublisher:HOLT MCDOUGAL
 College Algebra (MindTap Course List)AlgebraISBN:9781305652231Author:R. David Gustafson, Jeff HughesPublisher:Cengage Learning
 Glencoe Algebra 1, Student Edition, 9780079039897...AlgebraISBN:9780079039897Author:CarterPublisher:McGraw Hill