
Concept explainers
Videos
(a)
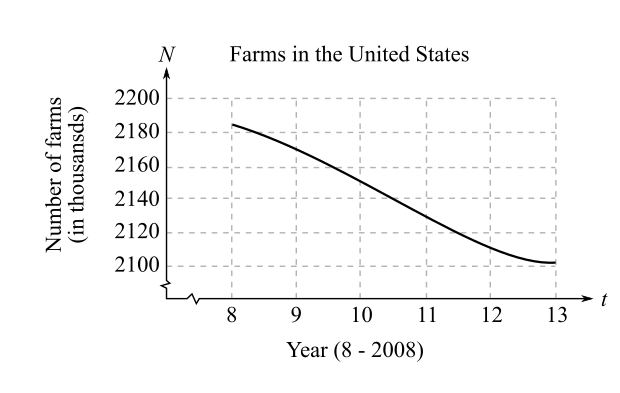
To calculate: The slopes of the graph for the years 2010 and 2012 if the number of farms from 2007 to 2013 can be modeled by
(b)
To calculate: The comparison between the above result obtained with those in exercise 6 where the graph represents the number of farms in United States from 2008 through 2013 where t represents the year, with t as 8 equals to 2008.
(c)
The interpretation of the slope of the graph if the revenue from 2007 to 2013 can be modeled by
Want to see the full answer?
Check out a sample textbook solution
Chapter 2 Solutions
Bundle: Calculus: An Applied Approach, Loose-Leaf Version, 10th + WebAssign Printed Access Card for Larson's Calculus: An Applied Approach, 10th Edition, Single-Term


 Glencoe Algebra 1, Student Edition, 9780079039897...AlgebraISBN:9780079039897Author:CarterPublisher:McGraw Hill
 College Algebra (MindTap Course List)AlgebraISBN:9781305652231Author:R. David Gustafson, Jeff HughesPublisher:Cengage Learning
 Big Ideas Math A Bridge To Success Algebra 1: Stu...AlgebraISBN:9781680331141Author:HOUGHTON MIFFLIN HARCOURTPublisher:Houghton Mifflin Harcourt
 Algebra: Structure And Method, Book 1AlgebraISBN:9780395977224Author:Richard G. Brown, Mary P. Dolciani, Robert H. Sorgenfrey, William L. ColePublisher:McDougal Littell
