
Concept explainers
Videos
A survey of commercial buildings served by the Cincinnati Gas & Electric Company asked what main heating fuel was used and what year the building was constructed. A partial crosstabulation of the findings follows.
| Fuel Type | |||||
| Year Constructed | Electricity | Natural Gas | Oil | Propane | Other |
| 1973 or before | 40 | 183 | 12 | 5 | 7 |
| 1974–1979 | 24 | 26 | 2 | 2 | 0 |
| 1980–1986 | 37 | 38 | 1 | 0 | 6 |
| 1987–1991 | 48 | 70 | 2 | 0 | 1 |
- a. Complete the crosstabulation by showing the row totals and column totals.
- b. Show the frequency distributions for year constructed and for fuel type.
- c. Prepare a crosstabulation showing column percentages.
- d. Prepare a crosstabulation showing row percentages.
- e. Comment on the relationship between year constructed and fuel type.
a.
Complete the cross tabulation by showing the row totals and column totals.
Answer to Problem 52SE
The completed cross tabulation is,
| Fuel Type | Total | |||||
| Year Constructed | Electricity | Natural Gas | Oil | Propane | Other | |
| 1973 or more | 40 | 183 | 12 | 5 | 7 | 247 |
| 1974-1979 | 24 | 26 | 2 | 2 | 0 | 54 |
| 1980-1986 | 37 | 38 | 1 | 0 | 6 | 82 |
| 1987-1991 | 48 | 70 | 2 | 0 | 1 | 121 |
| Total | 149 | 317 | 17 | 7 | 14 | 504 |
Explanation of Solution
Calculation:
The given information is that a partial cross tabulation of fuel type and year constructed.
The row total and column total can be obtained as follows:
The remaining row and column total can be obtained as follows:
| Fuel Type | Total | |||||
| Year Constructed | Electricity | Natural Gas | Oil | Propane | Other | |
| 1973 or more | 40 | 183 | 12 | 5 | 7 | 247 |
| 1974-1979 | 24 | 26 | 2 | 2 | 0 | 54 |
| 1980-1986 | 37 | 38 | 1 | 0 | 6 | 82 |
| 1987-1991 | 48 | 70 | 2 | 0 | 1 | 121 |
| Total | 149 | 317 | 17 | 7 | 14 | 504 |
b.
Construct a frequency distribution for year constructed and for fuel type.
Answer to Problem 52SE
The frequency distribution for year constructed is,
| Year Constructed | Frequency |
| 1973 or more | 247 |
| 1974–1979 | 54 |
| 1980–1986 | 82 |
| 1987–1991 | 121 |
| Total | 504 |
The frequency distribution for fuel type is,
| Fuel Type | Frequency |
| Electricity | 149 |
| Natural Gas | 317 |
| Oil | 17 |
| Propane | 7 |
| Other | 14 |
| Total | 504 |
Explanation of Solution
Calculation:
For year constructed:
The frequencies are calculated by using the tally mark for each class interval.
- The class intervals are “1973 or more”, “1974–1979”, “1980–1986” and “1987–1991”.
- Make a tally mark for each value of year constructed in the corresponding class interval and continue for all values in the data.
- The number of tally marks in each class represents the frequency, f of that class.
The frequency distribution for year constructed is obtained as given below:
| Year Constructed | Tally marks | Frequency |
| 1973 or more | 247 | |
| 1974–1979 | 54 | |
| 1980–1986 | 82 | |
| 1987–1991 | 121 | |
| Total | 504 |
For fuel type:
Here, “electricity” is the type of fuel which is repeated for 149 times in the data set and thus 149 is the frequency for the fuel type electricity.
Similarly, the frequency of remaining company size is given below:
| Fuel Type | Frequency |
| Electricity | 149 |
| Natural Gas | 317 |
| Oil | 17 |
| Propane | 7 |
| Other | 14 |
| Total | 504 |
c.
Compute a cross tabulation showing column percentages for the data.
Answer to Problem 52SE
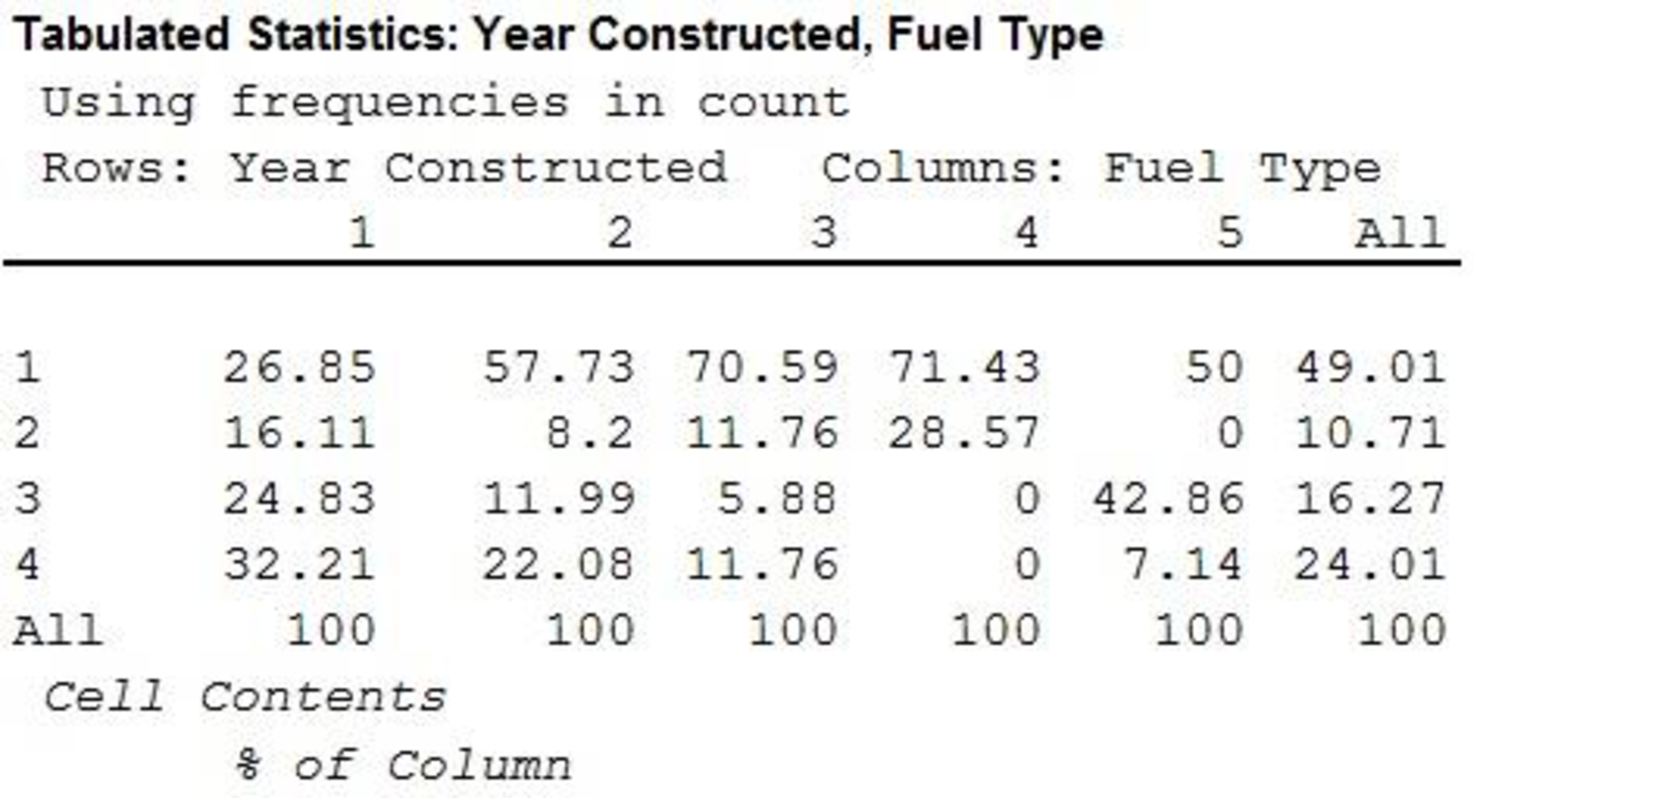
Cross tabulation of column percentages is:
| Fuel Type | |||||
| Year Constructed | Electricity | Natural Gas | Oil | Propane | Other |
| 1973 or more | 26.85 | 57.73 | 70.59 | 71.43 | 50 |
| 1974–1979 | 16.11 | 8.2 | 11.76 | 28.57 | 0 |
| 1980–1979 | 24.83 | 11.99 | 5.88 | 0 | 42.86 |
| 1987–1991 | 32.21 | 22.08 | 11.76 | 0 | 7.14 |
| Total | 100 | 100 | 100 | 100 | 100 |
Explanation of Solution
Calculation:
Software procedure:
Step-by-step procedure to construct the column percentage using MINITAB software is given below:
- Choose stat>tables>cross tabulation and chi square.
- Choose raw data (summarized).
- In rows, enter the column of year constructed.
- In columns, enter the column of fuel type.
- Under display, select column percent.
- Click OK
Output using the MINITAB software is given below:
d.
Compute the cross tabulation showing row percentages for the data.
Answer to Problem 52SE
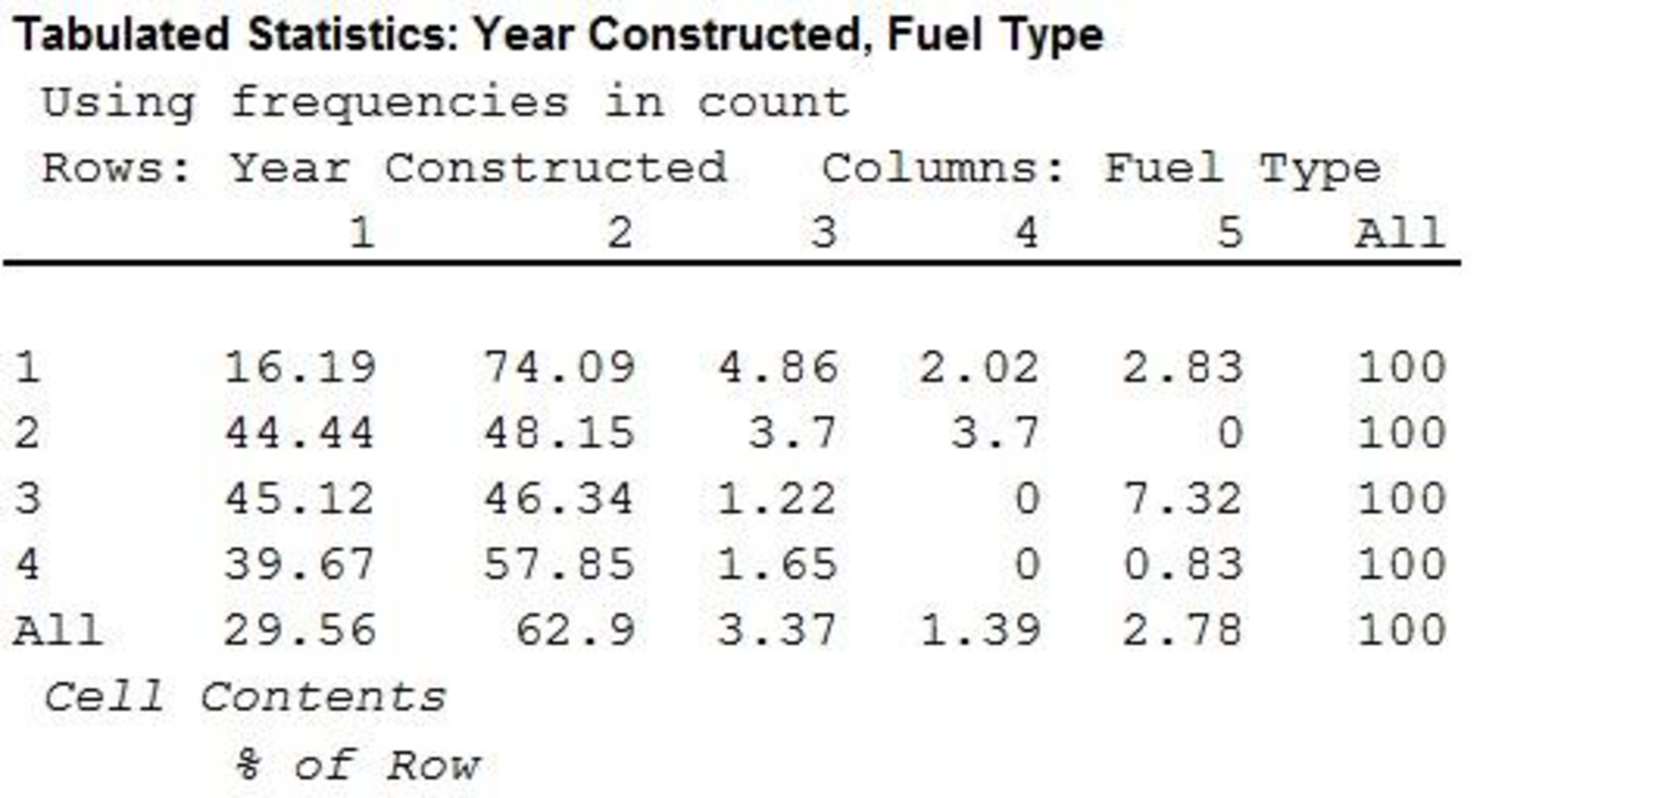
| Fuel Type | Total | |||||
| Year Constructed | Electricity | Natural Gas | Oil | Propane | Other | |
| 1973 or more | 16.19 | 74.09 | 4.86 | 2.02 | 2.83 | 100 |
| 1974–1979 | 44.44 | 48.15 | 3.7 | 3.7 | 0 | 100 |
| 1980–1979 | 45.12 | 46.34 | 1.22 | 0 | 7.32 | 100 |
| 1987–1991 | 39.67 | 57.85 | 1.65 | 0 | 0.83 | 100 |
Explanation of Solution
Calculation:
Software procedure:
Step-by-step procedure to construct the row percentage using MINITAB software is given below:
- Choose stat>tables>cross tabulation and chi square.
- Choose raw data (summarized).
- In rows, enter the column of year constructed.
- In columns, enter the column of fuel type.
- Under display, select row percent.
- Click OK
Output using the MINITAB software is given below:
e.
Comment on the relationship between year constructed and fuel type.
Explanation of Solution
Observations from the column percentages cross tabulation:
The percentage of buildings using electricity has not changed greatly over the years. Most of the buildings using natural gas were constructed in 1973 or before. Also for the buildings using oil most of them were constructed in 1973 or before. The percentage of buildings using propane was constructed in 1973 or before.
Observations from the row percentages cross tabulation:
Most of the building was constructed using electricity or natural gas. In 1973 or before most of the buildings used natural gas. In the period 1974–1979, most of the building was constructed using electricity and natural gas. From 1987 onwards most of the building was constructed using natural gas and second largest percentage was constructed using electricity.
Want to see more full solutions like this?
Chapter 2 Solutions
EBK STATISTICS FOR BUSINESS & ECONOMICS


- A wholesale T-shirt company oilers sizes small, medium, large, and extra-large in organic or non- organic cotton and colors white, black, gray, blue, and red. How many different T-shirts are there to choose from?arrow_forwardA hospital cafeteria offers a fixed-price lunch consisting of a main course, a dessert and a drink. If there are four main courses, three desserts, and six drinks to pick from, in how many ways can a customer select a meal consisting of one choice from each category?arrow_forwardAnswer the following questions. 5. What is the term for the arrangement that selects r objects from a set of ii objects when the order of the r objects is not important? What is the formula for calculating the number of possible outcomes for this type of arrangement?arrow_forward
 Linear Algebra: A Modern IntroductionAlgebraISBN:9781285463247Author:David PoolePublisher:Cengage Learning
 College AlgebraAlgebraISBN:9781305115545Author:James Stewart, Lothar Redlin, Saleem WatsonPublisher:Cengage Learning
 Algebra and Trigonometry (MindTap Course List)AlgebraISBN:9781305071742Author:James Stewart, Lothar Redlin, Saleem WatsonPublisher:Cengage Learning
 College Algebra (MindTap Course List)AlgebraISBN:9781305652231Author:R. David Gustafson, Jeff HughesPublisher:Cengage Learning