
Concept explainers
Videos
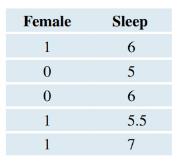
Sleep The following table shows the first few entries for the number of hours of sleep in one night for a sample of college students. The data are stacked and coded, where 0 represents a male student and 1 represents a female student. What would be appropriate graphs to compare the distributions of hours of sleep in one night for male and female college students if you had the complete data set? Explain. Write a statistical question that can be answered with the complete data.
Want to see the full answer?
Check out a sample textbook solution
Chapter 2 Solutions
EP INTRODUCTORY STATISTICS-MYSTATLAB
Additional Math Textbook Solutions
Business Statistics: A First Course (7th Edition)
The Practice of Statistics for AP - 4th Edition
Intro Stats, Books a la Carte Edition (5th Edition)
Elementary Statistics: A Step By Step Approach
Introductory Statistics (10th Edition)
Statistics for Business & Economics, Revised (MindTap Course List)


 Glencoe Algebra 1, Student Edition, 9780079039897...AlgebraISBN:9780079039897Author:CarterPublisher:McGraw Hill
 Holt Mcdougal Larson Pre-algebra: Student Edition...AlgebraISBN:9780547587776Author:HOLT MCDOUGALPublisher:HOLT MCDOUGAL
 Big Ideas Math A Bridge To Success Algebra 1: Stu...AlgebraISBN:9781680331141Author:HOUGHTON MIFFLIN HARCOURTPublisher:Houghton Mifflin Harcourt