
Videos
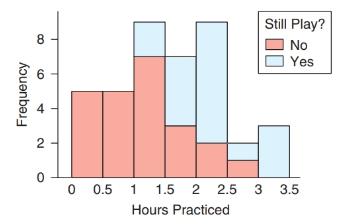
Musicians Survey: StatCrunch Graph The accompanying graph is a special histogram with additional information; it was made using StatCrunch. People who studied music as children were asked how many hours a day they practiced when they were teenagers, and whether they still play now that they are adults. To understand the graph, look at the third bar (spanning 1.0 to 1.5); it shows that there were seven people (the light red part of the bar) who practiced between 1.0 and 1.5 hours and did not still play as adults, and there were two people (the light blue part of the bar) who practiced 1.0 to 1.5 hours and still play as adults. Comment on what the graph shows. What other types of graphs could be used for this data set?
Want to see the full answer?
Check out a sample textbook solution
Chapter 2 Solutions
EP INTRODUCTORY STATISTICS-MYSTATLAB
Additional Math Textbook Solutions
Intro Stats, Books a la Carte Edition (5th Edition)
Fundamentals of Statistics (5th Edition)
Elementary Statistics: A Step By Step Approach
The Practice of Statistics for AP - 4th Edition
Probability and Statistics for Engineering and the Sciences
EBK STATISTICAL TECHNIQUES IN BUSINESS


 Glencoe Algebra 1, Student Edition, 9780079039897...AlgebraISBN:9780079039897Author:CarterPublisher:McGraw Hill
 Holt Mcdougal Larson Pre-algebra: Student Edition...AlgebraISBN:9780547587776Author:HOLT MCDOUGALPublisher:HOLT MCDOUGAL