
Concept explainers
Videos
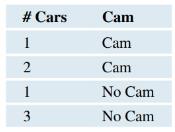
Traffic Cameras College students Jeannette Mujica, Ricardo Ceja Zarate, and Jessica Cerda conducted a survey in Oxnard, California, of the number of cars going through a yellow light at intersections with and without traffic cameras that are used to automatically fine drivers who run red lights. The cameras were very noticeable to drivers. The amount of traffic was constant throughout the study period (the afternoon commute.) The data record the number of cars that crossed the intersection during a yellow light for each light cycle. A small excerpt of the data is shown in the following table; see this text’s website for all the data. What differences, if any, do you see between intersections with cameras and those without? Use an appropriate graphical summary, and write a comparison of the distributions.
Want to see the full answer?
Check out a sample textbook solution
Chapter 2 Solutions
EP INTRODUCTORY STATISTICS-MYSTATLAB
Additional Math Textbook Solutions
Stats: Modeling the World Nasta Edition Grades 9-12
Basic Business Statistics, Student Value Edition (13th Edition)
Introduction to Statistical Quality Control
Research Methods for the Behavioral Sciences (MindTap Course List)
Statistics for Business and Economics (13th Edition)
The Practice of Statistics for AP - 4th Edition


 Big Ideas Math A Bridge To Success Algebra 1: Stu...AlgebraISBN:9781680331141Author:HOUGHTON MIFFLIN HARCOURTPublisher:Houghton Mifflin Harcourt
 Glencoe Algebra 1, Student Edition, 9780079039897...AlgebraISBN:9780079039897Author:CarterPublisher:McGraw Hill
 Holt Mcdougal Larson Pre-algebra: Student Edition...AlgebraISBN:9780547587776Author:HOLT MCDOUGALPublisher:HOLT MCDOUGAL
 Functions and Change: A Modeling Approach to Coll...AlgebraISBN:9781337111348Author:Bruce Crauder, Benny Evans, Alan NoellPublisher:Cengage Learning