Concept explainers
Videos
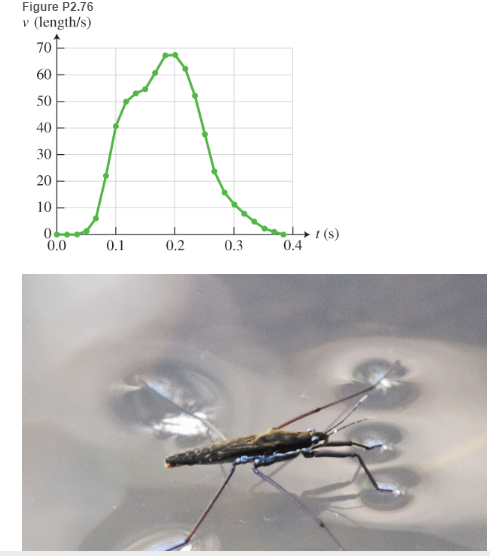
* BIO EST Water striders Water striders are insects that propel themselves on the surface of ponds by creating vortices in the water shed by their driving legs. The velocity- versus-time graph of a 17-mm-long water strider that moved in a straight line was created from a video (Figure P2.76). The insect started from rest, sped up by taking two strides, and then slowed down until it stopped. Estimate (a) the maximum speed (in m/s), (b) the maximum acceleration (in
Want to see the full answer?
Check out a sample textbook solution
Chapter 2 Solutions
College Physics
Additional Science Textbook Solutions
Physics: Principles with Applications
Lecture- Tutorials for Introductory Astronomy
University Physics Volume 2
Conceptual Physics (12th Edition)
College Physics (10th Edition)
An Introduction to Thermal Physics


- A student drives a moped along a straight road as described by the velocity-versus-time graph in Figure P2.12. Sketch this graph in the middle of a sheet of graph paper. (a) Directly above your graph, sketch a graph of the position versus time, aligning the time coordinates of the two graphs. (b) Sketch a graph of the acceleration versus time directly below the velocity-versus-time graph, again aligning the time coordinates. On each graph, show the numerical values of x and ax for all points of inflection. (c) What is the acceleration at t = 6.00 s? (d) Find the position (relative to the starting point) at t = 6.00 s. (e) What is the mopeds final position at t = 9.00 s? Figure P2.12arrow_forwardCase Study Crall and Whipple attached a fan to a cart placed on a level track and then released the cart. They made a position-versus-time graph (Fig. P2.54) and fit a curve to these data such that x=0.036m+(0.0080m/s)t+(0.10m/s2)t2 a. Find and graph the velocity as a function of time. b. What is the shape of the velocity-versus-time graph? What do you expect the acceleration-versus-time graph to look like? Explain. c. Find and graph the acceleration as a function of time.arrow_forwardThe Acela is an electric train on the Washington-New YorkBoston run, carrying passengers at 170 mi/h. A velocity-time graph for the Acela is shown in Figure P2.69. (a) Describe the train's motion in each successive lime interval, (b) Find the trains peak positive acceleration in the motion graphed, (c) Find the trains displacement in miles between t = 0 and t = 200 s.arrow_forward
- (a) A world record was set for the men's 100-m dash in the 2008 Olympic Games in Beijing by Usain Bolt of Jamaica. Bolt "coasted" across the finish line with a time of 9.69 s. If we assume that Bolt accelerated for 3.00 s to reach his maximum speed, and maintained that speed for the rest of the race, calculate his maximum speed and his acceleration. (b) During the same Olympics, Bolt also set the world record in the 200-m dash with a time of 19.30 s. Using the same assumptions as for the 100-m dash, what was his maximum speed for this race?arrow_forwardA glider of length moves through a stationary photogate on an air track. A photogate (Fig. P2.44) is a device that measures the time interval td during which the glider blocks a beam of infrared light passing across the photogate. The ratio vd = /td is the average velocity of the glider over this part of its motion. Suppose the glider moves with constant acceleration. (a) Argue for or against the idea that vd is equal to the instantaneous velocity of the glider when it is halfway through the photogate in space. (b) Argue for or against the idea that vd is equal to the instantaneous velocity of the glider when it is halfway through the photogate in time.arrow_forwardA student drives a moped along a straight road as described by the velocitytime graph in Figure P2.32. Sketch this graph in the middle of a sheet of graph paper. (a) Directly above your graph, sketch a graph of the position versus time, aligning the time coordinates of the two graphs. (b) Sketch a graph of the acceleration versus time directly below the velocitytime graph, again aligning the time coordinates. On each graph, show the numerical values of x and ax for all points of inflection. (c) What is the acceleration at t = 6.00 s? (d) Find the position (relative to the starting point) at t = 6.00 s. (e) What is the mopeds final position at t = 9.00 s? Figure P2.32arrow_forward
- A speedboat travels in a straight line and increases in speed uniformly from i = 20.0 m/s to f = 30.0 m/s in displacement x of 200 m. We wish to find the time interval required for the boat to move through this displacement, (a) Draw a coordinate system for this situation, (b) What analysis model is most appropriate for describing this situation? (c) From the analysis model, what equation is most appropriate for finding the acceleration of the speedboat? (d) Solve the equation selected in part (c) symbolically for the boats acceleration in terms of i, f, and x. (e) Substitute numerical values lo obtain the acceleration numerically. (f) Find the time interval mentioned above.arrow_forwardKathy tests her new sports car by racing with Sian, an experienced racer. Both start from rest, but Kathy leaves the starting line 1.00 s after Stan does. Stan moves with a constant acceleration of 3.50 m/s2, while Kathy maintains an acceleration of 4.90 m/s2. Find (a) the time at which Kathy overtakes Stan, (b) the distance she travels before she catches him, and (c) the speeds of both cars at the instant Kathy overtakes Stan.arrow_forwardFigure P2.9 shows a graph of vx versus t for the motion of a motorcyclist as he starts from rest and moves along the road in a straight line. (a) Find the average acceleration for the time interval t = 0 to t = 6.00 s. (b) Estimate the time at which the acceleration has its greatest positive value and the value of the acceleration at that instant. (c) When is the acceleration zero? (d) Estimate the maximum negative value of the acceleration and the time at which it occurs. Figure P2.9arrow_forward
- (a) Differentiate between speed and velocity. (b) The speed versus time graph for an object is shown below: (i) Describe the motion of the object. (ii) Calculate the total distance covered by the object in 10 s. (iii) Calculate the average speed of the object after 10 s.arrow_forwardA student drives a moped along a straight road as described by the velocity–time graph in Figure P2.58. Sketch this graph in the middle of a sheet of graph paper. (a) Directly above your graph, sketch a graph of the position versus time, aligning the time coordinates of the two graphs. (b) Sketch a graph of the acceleration versus time directly below the velocity–time graph, again aligning the time coordinates. On each graph, show the numerical values of x and ax for all points of inflection. (c) What is the acceleration at t = 6.00 s? (d) Find the position (relative to the starting point) at t = 6.00 s. (e) What is the moped’s final position at t = 9.00 s?arrow_forwardAn ice sled powered by a rocket engine starts from rest on a large frozen lake and accelerates at +13m/s^2. At t1, the rocket engine is shut down and the sled moves with constant velocity v until t2. The total distance traveled by the sled is 5.30*10^3 m and the total time is 90s. Find t1,t2, and v.arrow_forward
 College PhysicsPhysicsISBN:9781938168000Author:Paul Peter Urone, Roger HinrichsPublisher:OpenStax College
 Principles of Physics: A Calculus-Based TextPhysicsISBN:9781133104261Author:Raymond A. Serway, John W. JewettPublisher:Cengage Learning
 Physics for Scientists and Engineers, Technology ...PhysicsISBN:9781305116399Author:Raymond A. Serway, John W. JewettPublisher:Cengage Learning
 Physics for Scientists and Engineers: Foundations...PhysicsISBN:9781133939146Author:Katz, Debora M.Publisher:Cengage Learning
 Physics for Scientists and Engineers with Modern ...PhysicsISBN:9781337553292Author:Raymond A. Serway, John W. JewettPublisher:Cengage Learning
 Physics for Scientists and EngineersPhysicsISBN:9781337553278Author:Raymond A. Serway, John W. JewettPublisher:Cengage Learning