Basic Business Statistics, Student Value Edition
14th Edition
ISBN: 9780134685113
Author: Mark L. Berenson, David M. Levine, David F. Stephan, Kathryn Szabat
Publisher: PEARSON
bartleby

Concept explainers

bartleby

Videos

Textbook Question
Book Icon
Chapter 2, Problem 90PS

B2B marketers in North America were surveyed about content marketing usage, organization, and success. Content marketers were asked about how content marketing is structured within their organization and how they would describe their or content marketing. Tables in this problem summarize the survey results.

Chapter 2, Problem 90PS, B2B marketers in North America were surveyed about content marketing usage, organization, and , example  1

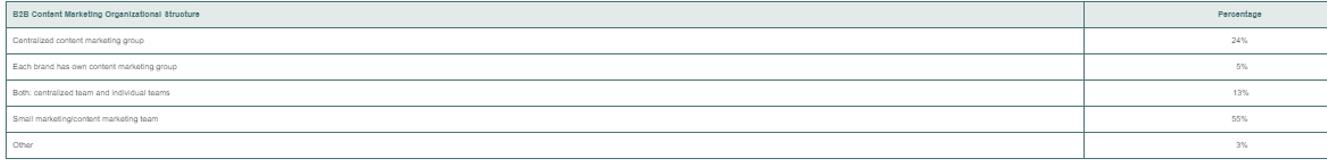
a. Construct a bar chart, a pie or doughnut chart, and a Pareto chart for this table.

b. Which graphical method do you think is best for portraying these data?

Chapter 2, Problem 90PS, B2B marketers in North America were surveyed about content marketing usage, organization, and , example  2

c. Construct a bar chart, a pie or doughnut chart, and a Pareto chart for this table.

d. Which graphical method do you think is best for portraying these data?

e. Based on the two tables, which conclusions can you reach concerning marketer’s perspective on content marketing?

Blurred answer
Students have asked these similar questions
A government agency reported the given sources of electricity in a particular area in 2010. a. Construct a Pareto chart. b. What percentage of power is derived from​ coal, nuclear, or natural​ gas? c. Construct a pie chart. d. For these​ data, is it better to use a Pareto chart or the pie​ chart? Why? Source of Electricity Percentage (%) A. Coal  44% B. Hydroelectric 9% C. Natural Gas 26% D. Nuclear 16% E. Other 5%
Much of the world's diamond industry is located in Africa, with Russia and Canada also showing large revenues from their diamond mining industry. A visual representation of the various shares of the world’s diamond revenues, adapted from Time Magazine,15 is shown below:See Attachmenta. Draw a pie chart to describe the various shares of the world’s diamond revenues.b. Draw a bar chart to describe the various shares of the world’s diamond revenues.c. Draw a Pareto chart to describe the various shares of the world’s diamond revenues.d. Which of the charts is the most effective in describing the data?
The Party of Nonvoters From past elections, nonvoters are those who are either not registered to vote or are considered unlikely to vote in an upcoming election. Nonvoters are very different demographically from likely voters.Nonvoters are more racially and ethnically diverse. 43% of those who are not likely to cast a ballot are Hispanic, African or other racial and ethnic minorities, roughly double the percentage amoung likely voters(22%) (Source: Pew Research Center, October, 2014, "The Party of Nonvoters"). Suppose you interview 10 people who are considered nonvoters. Round answers to 4 decimal places.a.) What is the probability that 5 of them are an ethnic minority? b.) What is the probability that more than 8 are an ethnic minority? c.) What is the probability that at least 8 are not an ethnic minority? d.) What is the probability that fewer than 5 are not an ethnic minority?

Chapter 2 Solutions

Basic Business Statistics, Student Value Edition

Ch. 2 - Construct an ordered array, given the following...Ch. 2 - Construct an ordered array, given the following...Ch. 2 - Planning and preparing for the unexpected,...Ch. 2 - Data was collected on salaries of compliance...Ch. 2 - The file NBACost contains the total cost ($ ) for...Ch. 2 - The file Utility contains the following data about...Ch. 2 - How much time do commuters living in or near...Ch. 2 - How do the average credit scores of people living...Ch. 2 - One operation of a mill is to cut pieces of steel...Ch. 2 - Call centers today play an important role in...Ch. 2 - The financial service call centre in problem 2.20...Ch. 2 - The file Bulbs contains the life (in hours) of a...Ch. 2 - The file Drink Contains the following data for the...Ch. 2 - A survey of online shoppers revealed that in 2015...Ch. 2 - How do college students spend their day? The 2016...Ch. 2 - The Energy Information Administration reported the...Ch. 2 - The Consumer Financial Protection Bureau reports...Ch. 2 - The following table indicates the percentage of...Ch. 2 - Timetric’s 2016 survey of insurance...Ch. 2 - A survey of 1,520 American adults asked “Do you...Ch. 2 - A study of selected Kickstarter projects showed...Ch. 2 - Do special recommendations increase ad...Ch. 2 - Construct a stern-and-leaf display, given the...Ch. 2 - Construct an ordered array, given the following...Ch. 2 - The following is a stern-and0-leaf display...Ch. 2 - The file NBACost contains the total cost in$ for...Ch. 2 - The file MobileSpeed contains the overall download...Ch. 2 - The file Utility contains the following data about...Ch. 2 - As player salaries have increases, the cost of...Ch. 2 - The following histogram and cumulative percentage...Ch. 2 - How much time do Americans living in cities spend...Ch. 2 - How do the average credit scores of people living...Ch. 2 - One operation of a mill is to cut pieces of steel...Ch. 2 - Call centers today play an important role in...Ch. 2 - The financial service call center in problem 2.44...Ch. 2 - The file Bulbs contains the life (in hours) of a...Ch. 2 - The data stored in Drink represents the amount of...Ch. 2 - The following is a set of data from a sample of...Ch. 2 - The following is a series of annual sales...Ch. 2 - Movie companies need to predict the gross receipts...Ch. 2 - Data were collected on the typical cost of dining...Ch. 2 - The file Mobile contains the overall download and...Ch. 2 - A Pew Research Center survey found a noticeable...Ch. 2 - How have stocks performed in the past? The...Ch. 2 - The file NewHomeSales contains the number of new...Ch. 2 - The file Movie Attendance 16 contains the yearly...Ch. 2 - The Super Bowl is a big viewing event watched by...Ch. 2 - Using the sample of retirement funds stored in...Ch. 2 - Using the sample of retirement funds stored in...Ch. 2 - Prob. 60PSCh. 2 - Using the sample of retirement funds stored in...Ch. 2 - Prob. 62PSCh. 2 - Using the sample of retirement funds stored in...Ch. 2 - Prob. 64PSCh. 2 - Using the sample of retirement funds stored in...Ch. 2 - Prob. 66PSCh. 2 - Prob. 67PSCh. 2 - Prob. 68PSCh. 2 - Prob. 71PSCh. 2 - Prob. 72PSCh. 2 - Examine the following visualization, adapted from...Ch. 2 - Prob. 75PSCh. 2 - Prob. 76PSCh. 2 - How do histograms and polygons differ in...Ch. 2 - Why would you construct a summary table?Ch. 2 - What are the advantages and disadvantage of using...Ch. 2 - Compare and contrast the bar chart for categorical...Ch. 2 - What is the difference between a time-series plot...Ch. 2 - Why is it said that the main feature of a Pareto...Ch. 2 - What are the three different ways to break down...Ch. 2 - How can a multidimensional table differ from a...Ch. 2 - What type of insights can you gain from a...Ch. 2 - Prob. 86PSCh. 2 - What is the difference between a time-series plot...Ch. 2 - The following table shown in the TextbookCosts...Ch. 2 - The following table represents the market share...Ch. 2 - B2B marketers in North America were surveyed about...Ch. 2 - The owner of a restaurant that services...Ch. 2 - Suppose that the owner of the restaurant in...Ch. 2 - The following data represents the pounds per...Ch. 2 - The Air Travel Consumer Report, a monthly product...Ch. 2 - One of the major measures of the quality of...Ch. 2 - The file DomesticBeer Contains the percentage...Ch. 2 - Prob. 97PSCh. 2 - The file CDRate contains the yields for one-year...Ch. 2 - The file CEO 2016 includes the total compensation...Ch. 2 - Prob. 100PSCh. 2 - What was the average price of a room at two-star,...Ch. 2 - The file Protein contains calorie and cholesterol...Ch. 2 - The file Natural Gas contains the U.S. monthly...Ch. 2 - The data stored in Drink represent the amount of...Ch. 2 - Prob. 105PSCh. 2 - A/B testing allows business to test a new design...Ch. 2 - Referring to the results from Problem 2.100 on...
Knowledge Booster
Background pattern image
Statistics
Learn more about
Need a deep-dive on the concept behind this application? Look no further. Learn more about this topic, statistics and related others by exploring similar questions and additional content below.
Similar questions
Recommended textbooks for you
Text book image
Holt Mcdougal Larson Pre-algebra: Student Edition...
Algebra
ISBN:9780547587776
Author:HOLT MCDOUGAL
Publisher:HOLT MCDOUGAL
Text book image
Glencoe Algebra 1, Student Edition, 9780079039897...
Algebra
ISBN:9780079039897
Author:Carter
Publisher:McGraw Hill
Text book image
Big Ideas Math A Bridge To Success Algebra 1: Stu...
Algebra
ISBN:9781680331141
Author:HOUGHTON MIFFLIN HARCOURT
Publisher:Houghton Mifflin Harcourt
Which is the best chart: Selecting among 14 types of charts Part II; Author: 365 Data Science;https://www.youtube.com/watch?v=qGaIB-bRn-A;License: Standard YouTube License, CC-BY