
The comparative advantage of countries.
Answer to Problem 2P
a. New Zealand- The cost of producing 1 Apple is 0.25 plums and the cost of producing 1 plum is 4 Apples.
Spain- The cost of producing 1 Apple is 1 plum and the cost of producing 1 plum is 1 Apple.
b. New Zealand should produce apples and Spain should produce plums.
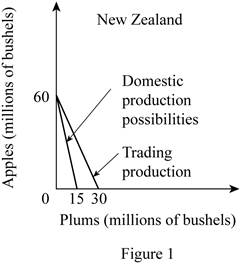
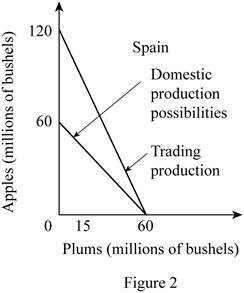
c. Graph
d. The total gain of Apples is 20 and the total gain of plums is 10.
Explanation of Solution
The comparative advantage is the advantage that the country has over the competitor in the
Option (a):
In New Zealand, the production of 20 apples needs the resources which can alternatively be used for the production of 5 plums. Thus, the opportunity cost of producing 1 apple can be calculated by dividing the total units of plums given up by the total units of apples gained as follows:
Thus, the opportunity cost of producing 1 apple in New Zealand is 0.25 plum.
The opportunity cost of producing plum in New Zealand can be calculated by dividing the number of units of apples given up with the number of units of plums gained as follows:
So, the opportunity cost of producing 1 plum in New Zealand is 4 apples.
In Spain, the production of 20 apples needs the resources which can alternatively be used for the production of 20 plums. Thus, the opportunity cost of producing 1 apple can be calculated by dividing the total units of plums given up by the total units of apples gained as follows:
Thus, the opportunity cost of producing 1 apple in Spain is 1 plum.
The opportunity cost of producing plum in Spain can be calculated by dividing the number of units of apples given up with the number of units of plums gained as follows:
So, the opportunity cost of producing 1 plum in Spain is 1 apple.
Option (b):
The opportunity cost of producing a unit of apple is lower in New Zealand (0.25 Plum) compared to Spain (1 Plum). Thus, New Zealand should specialize in the production of apples.
The opportunity cost of producing a unit of plum is lower in Spain (1 Apple) compared to that in New Zealand (4 Apples). Thus, Spain should specialize in the production of plums.
Option (c):
Before the trade, the
According to the terms of trade of
Similarly, Spain can have 2 apples for 1 plum in the international trade which will increase their total possible consumption of apples from 60 million bushels to 120 million bushels. Thus, the vertical intercept of the Spain's production possibility curve will increase to 120 million bushels. So, the slope of the production possibility curve of Spain will decrease from -1 to -0.5.
The changes are shown in the diagram as follows:
Option (d):
The mixed product of New Zealand is B and of Spain is S. According to the table, the total output of apples in New Zealand at this mixed product is 20 million bushels and the output of plums is 10 million bushels. Similarly, at the given output combination S of Spain, the total output of apples is 20 million bushes and of plums is 40 million bushels.
Thus, the total output of the apple and plum before the trade can be calculated by adding the individual quantities of apples that are produced in New Zealand and Spain together are as follows:
Thus, the total output of apples before the trade was 40 million bushels.
Similarly, the total output of plums can be calculated by adding together each country’s outputs are as follows:
Thus, the total output of plums before the trade was 50 million bushels.
After the specialization by New Zealand in the production of apples, the total output of apples increased to 60 million bushels. Similarly, the specialization by Spain in the production of plums increased the total output of plums to 60 million bushels. Thus, total
Thus, the total output gain of apples is 20 million bushels.
Similarly, the total output gain in the case of plums can be calculated as follows:
Thus, the total output gain in plums is 10 million bushels.
Concept introduction:
Comparative advantage: It is the ability of the producer, firm or a country to produce a good or service at the lowest opportunity cost of production than the competitors.
Specialization: It is the process of identifying the product in which, the country has the comparative advantage in the form of lower opportunity cost of production. Thus, they can focus on the production of that commodity which will increase the output and they can engage in an international exchange in order to obtain the products in which they don’t have any comparative advantage.
Want to see more full solutions like this?
Chapter 20 Solutions
MACROECONOMICS (LL)

- American apparel makers complain to Congress about competition from China. Congress decides to impose either a tariff or a quota on apparel imports from China. Which policy would Chinese apparel manufacturers prefer? LO26.4 a. Tariff. b. Quota.arrow_forward2. In the USA 1 unit of labor can produce 50 cars while in Canada 1 unit of labor can produce5 cars. The total amount of labor in each country is L = 100. Which one of these statements iscorrect?A. Canada has comparative advantage on the production of cars.B. The USA has comparative advantage on the production of cars.C. Since their production possibility frontiers are the similar neither country has comparativeadvantage on the production of cars.D. Not enough information to answer this question.arrow_forward1. Suppose there are two countries Peru and Japan that produce Food and Fuel. Peru can produce 7,523 units of Food or 17,853 units of Fuel using a labour force of 8000. Japan can produce 5,733 units of Food or 24,156 units of Fuel using a labour force of 5000. a) Which country has the comparative advantage in food? In fuel? Explain. b) Which good(s) should each country specialize in? c) Discuss the benefits of specialization for each country.arrow_forward
- Now suppose that if Zimbabwe uses all of its resources, it can produce 50,000 tons of metal ores or 100,000 delivery trucks (trading off at a constant rate). Suppose that if South Africa uses all of its resources, it can produce 20,000 tons of metal ores or 80,000 delivery trucks (trading off at a constant rate). What is the direction of trade (who exports what to whom)? Be sure to give the opportunity costs of production of both goods for both countries. What is one potential price of metal ores in terms of trucks at which both Zimbabwe and South Africa would benefit from trade? Rank the autarkic prices and the world price of metal ores from lowest to highest.arrow_forwardsugar, You have been asked to analyze the opportunity costs and comparative advantages to recommend an efficient trading relationship. Consider the production data provided. Prepare a brief report that: 3. Calculate and compare the opportunity costs of producing 1 unit of corn and 1 unit of sugar in each country. Which country has the lower opportunity cost for each good? 2. Determine which good each country has a comparative advantage in producing sugar and which one has a comparative advantage in producing corn. Explain your analysis. 3. Recommend a trading relationship that allows the countries to specialize based on comparative advantage. How would trade Improve economic efficiency? 4. Think about your own interests, skills, and opportunities. In what areas do you potentially have a comparative advantage over your peers or co-workers? Are there goods or services you could provide to others more efficiently? How could you maximize your advantages to achieve positive gains from trade…arrow_forwardSuppose that Poland and Wales both produce ale and glass. Poland's opportunity cost of producing a pane of glass is 4 kegs of ale while Wales's opportunity cost of producing a pane of glass is 12 kegs of ale. By comparing the opportunity cost of producing glass in the two countries, you can tell thatWales has a comparative advantage in the production of glass andPoland has a comparative advantage in the production of ale. Suppose that Poland and Wales consider trading glass and ale with each other. Poland can gain from specialization and trade as long as it receives more than of ale for each pane of glass it exports to Wales. Similarly, Wales can gain from trade as long as it receives more than of glass for each keg of ale it exports to Poland. Based on your answer to the last question, which of the following prices of trade (that is, price of glass in terms of ale) would allow both Wales and Poland to gain from trade? Check all that apply. 8 kegs of…arrow_forward
- P1. Let’s assume there are only 2 countries that produce 2 good. More specifically, suppose that the United States (US) and the United Kingdom (UK) each have 2 units of productive resources, 1 used to produce Wine, the other Cloth. The US can produce 40 units of Wine with 1 unit of productive resources and 40 units of Cloth with 1 unit of productive resources. The UK can produce 20 units of Wine with 1 unit of productive resources and 10 units of cloth with 1 unit of productive resources. Using this information, please answer the questions below: 1. What are the gains from trade? 2. What is the “range” of potential exchange rates between US and UK?arrow_forwardP1. Let’s assume there are only 2 countries that produce 2 good. More specifically, suppose that the United States (US) and the United Kingdom (UK) each have 2 units of productive resources, 1 used to produce Wine, the other Cloth. The US can produce 40 units of Wine with 1 unit of productive resources and 40 units of Cloth with 1 unit of productive resources. The UK can produce 20 units of Wine with 1 unit of productive resources and 10 units of cloth with 1 unit of productive resources. Using this information, please answer the questions below: *Who has an absolute advantage in the production of Wine? Cloth? *Who has a comparative advantage in the production of Wine? Cloth? *Given specialization, what is production before trade? After trade? *What are the gains from trade? *What is the “range” of potential exchange rates between US and UK? P2. Suppose that in Japan, without a tariff 10,000 cars will be sold per year at an equilibrium price of $20,000. With a $5,000 tariff,…arrow_forwardSuppose that the United States limits the amount of steel that can be imported from other countries. Using a PPF that puts units of steel on the horizontal axis and units of another good, such as food, on the vertical axis, explain how such a steel import quota will affect production of food and steel in the United States and alter our consumption possibilities. Will the quota make the United States better off as a whole? If not, will it make anyone in the United States better off? Explain. For 19.21, think of the PPF as that of steel produced in the United States and food produced in the United States (and not as total steel available for use in the United States)arrow_forward
- Suppose there is trade between Spain and France Suppose that each produce only two goods, and that they each have $140,000 of resources to spend on the production of these goods. France• France produces one unit of oil at a cost of $5 per unit. • France can produce one unit of beef at a cost of $17 per unit. Spain• Spain produces one unit of oil at a cost of $11 per unit. • Spain produces one unit of beef at a cost of $21 per unit. a)Which country has the comparative advantage in producing oil? Which has the comparative advantage in producing beef? b)Draw the Production Possibilities Frontier (PPF) for Spain under autarky. Draw this PPF with oil on the x-axis and beef on the y-axis. Label both the x-intercept and y-intercept Suppose now that Spain and France start trading with each other at a rate of 3 units of oil for 1 unit of beef. C) Draw the Production Possibilities Frontier (PPF) for Spain under this trade agreement. D) Draw this PPF with oil on the x-axis and beef on the…arrow_forwardWith respect to Table 2.5, indicate in each case the commodity in which each nation has a comparative advantage. Suppose that the US exchanges 4W for 4C with the UK. How much does the US gain in terms of cloth? How much does the UK gain in terms of cloth? What is the range for mutually beneficial trade?arrow_forwardConsider a two country, two goods, one factor (labor) model of international trade. Suppose home country require 1 units of labor to produce a unit of cloth and 1 unit of labor to produce a unit of wine (regardless of output levels). Foreign country requires 2 unit of labor to produce 1 unit of cloth and 1.5 units of labor to produce 1 unit of wine (regardless of output levels). (a) Which country has the comparative advantage in producing wine? Justify your answer. (b) Which country has the absolute advantage in producing wine? (c) Which country will have higher autarky price of wine in terms of cloth? (d) Suppose after trade, the international relative price settles at a level strictly between the autarky relative prices of the two countries. At the trade equilibrium, show which country will produce wine and which country will produce cloth.arrow_forward
 Exploring EconomicsEconomicsISBN:9781544336329Author:Robert L. SextonPublisher:SAGE Publications, Inc
 Brief Principles of Macroeconomics (MindTap Cours...EconomicsISBN:9781337091985Author:N. Gregory MankiwPublisher:Cengage Learning
 Essentials of Economics (MindTap Course List)EconomicsISBN:9781337091992Author:N. Gregory MankiwPublisher:Cengage Learning