
Videos
Climate change 2016 Data collected from around the globe (including the sea ice data of Exercise 23) show that the earth is getting warmer. The generally accepted explanation relates climate change to an increase in atmospheric levels of carbon dioxide (CO2) because CO2 is a greenhouse gas that traps the heat of the sun. A standard source of the mean annual CO2 concentration in the atmosphere (parts per million) is measurements taken at the top of Mauna Loa in Hawaii (away from any local contaminants) and available at ftp://aftp.cmdl.noaa.gov/ products/trends/co2/co2_annmean_mlo.txt.
Global temperature anomaly is the difference in mean global temperature relative to a base period of 1981 to 2010 in °C. It is available at www.ncdc.noaa.gov/cag/data-info/global.
Here are a
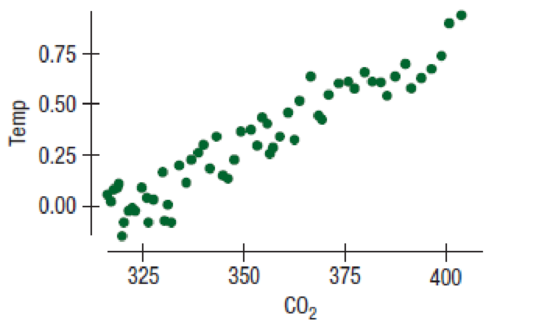
Response variable is: Temp
R squared = 89.7%
s = 0.0885 with 58 – 2 = 56 degrees of freedom
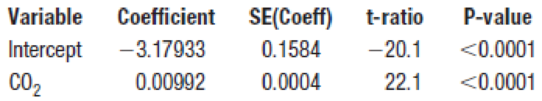
- a) Write the equation of the regression line.
- b) Is there evidence of an association between CO2 level and global temperature?
- c) Do you think predictions made by this regression will be very accurate? Explain.
- d) Does this regression prove that increasing CO2 levels are causing global warming? Discuss.
Want to see the full answer?
Check out a sample textbook solution
Chapter 20 Solutions
MyLab Statistics with Pearson eText -- Standalone Access Card -- for Intro Stats (5th Edition)


- What does the y -intercept on the graph of a logistic equation correspond to for a population modeled by that equation?arrow_forwardPlanetary Velocity The following table gives the mean velocity of planets in their orbits versus their mean distance from the sun. Note that 1AU astronomical unit is the mean distance from Earth to the sun, abut 93 million miles. Planet d=distance AU v=velocity km/sec Mercury 0.39 47.4 Venus 0.72 35.0 Earth 1.00 29.8 Mars 1.52 24.1 Jupiter 5.20 13.1 Saturn 9.58 9.7 Uranus 19.20 6.8 Neptune 30.05 5.4 Astronomers tell us that it is reasonable to model these data with a power function. a Use power regression to express velocity as a power function of distance from the sun. b Plot the data along with the regression equation. c An asteroid orbits at a mean distance of 3AU from the sun. According to the power model you found in part a, what is the mean orbital velocity of the asteroid?arrow_forwardCable TV The following table shows the number C. in millions, of basic subscribers to cable TV in the indicated year These data are from the Statistical Abstract of the United States. Year 1975 1980 1985 1990 1995 2000 C 9.8 17.5 35.4 50.5 60.6 60.6 a. Use regression to find a logistic model for these data. b. By what annual percentage would you expect the number of cable subscribers to grow in the absence of limiting factors? c. The estimated number of subscribers in 2005 was 65.3million. What light does this shed on the model you found in part a?arrow_forward
 Functions and Change: A Modeling Approach to Coll...AlgebraISBN:9781337111348Author:Bruce Crauder, Benny Evans, Alan NoellPublisher:Cengage Learning
 Linear Algebra: A Modern IntroductionAlgebraISBN:9781285463247Author:David PoolePublisher:Cengage Learning
 Glencoe Algebra 1, Student Edition, 9780079039897...AlgebraISBN:9780079039897Author:CarterPublisher:McGraw Hill
 Big Ideas Math A Bridge To Success Algebra 1: Stu...AlgebraISBN:9781680331141Author:HOUGHTON MIFFLIN HARCOURTPublisher:Houghton Mifflin Harcourt
 Algebra & Trigonometry with Analytic GeometryAlgebraISBN:9781133382119Author:SwokowskiPublisher:Cengage
 Trigonometry (MindTap Course List)TrigonometryISBN:9781337278461Author:Ron LarsonPublisher:Cengage Learning