MyLab Statistics with Pearson eText -- Standalone Access Card -- for Intro Stats (5th Edition)
5th Edition
ISBN: 9780134768366
Author: Richard D. De Veaux, Paul F. Velleman, David E. Bock
Publisher: PEARSON
expand_more
expand_more
format_list_bulleted
Concept explainers
Videos
Textbook Question
Chapter 20, Problem 62E
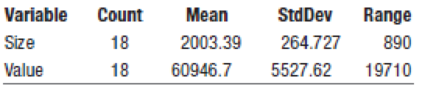
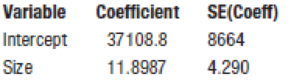
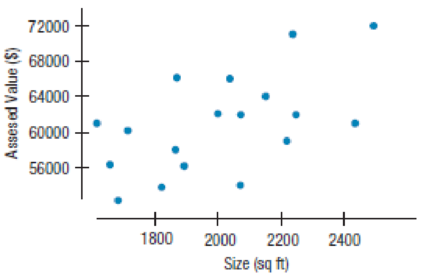
Property assessments The following software output provides information about the Size (in square feet) of 18 homes in Ithaca, New York, and the city’s assessed Value of those homes.
Dependent variable is Value
R-squared = 32.5%
s = 4682 with 18 – 2 = 16 degrees of freedom
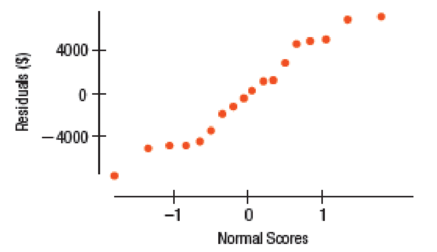
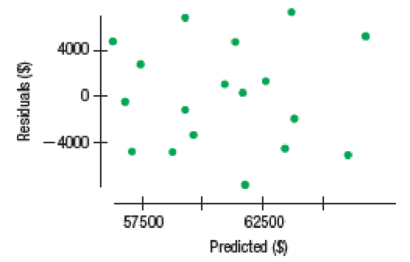
- a) Explain why inference for linear regression is appropriate with these data.
- b) Is there a significant association between the Size of a home and its assessed Value? Test an appropriate hypothesis and state your conclusion.
- c) What percentage of the variability in assessed Value is explained by this regression?
- d) Give a 90% confidence interval for the slope of the true regression line, and explain its meaning in the proper context.
- e) From this analysis, can we conclude that adding a room to your house will increase its assessed Value? Why or why not?
- f) The owner of a home measuring 2100 square feet files an appeal, claiming that the $70,200 assessed Value is too high. Do you agree? Explain your reasoning.
Expert Solution & Answer
Want to see the full answer?
Check out a sample textbook solution
Chapter 20 Solutions
MyLab Statistics with Pearson eText -- Standalone Access Card -- for Intro Stats (5th Edition)
Ch. 20.5 - Researchers in Food Science studied how big...Ch. 20.5 - Prob. 2JCCh. 20.5 - Prob. 3JCCh. 20.5 - Prob. 4JCCh. 20.5 - Prob. 5JCCh. 20.5 - Prob. 6JCCh. 20 - Graduate earnings Does attending college pay back...Ch. 20 - Shoot to score 2016 A college hockey coach...Ch. 20 - Prob. 3ECh. 20 - Shoot to score II Discuss the assumptions and...
Ch. 20 - Prob. 5ECh. 20 - Shoot to score, another one Using the regression...Ch. 20 - Prob. 7ECh. 20 - Shoot to score, hat trick Returning to the results...Ch. 20 - Prob. 9ECh. 20 - Shoot to score, number five What can the hockey...Ch. 20 - Prob. 11ECh. 20 - Prob. 12ECh. 20 - Prob. 13ECh. 20 - Prob. 14ECh. 20 - Prob. 15ECh. 20 - Shoot to score, double overtime Continuing from...Ch. 20 - Prob. 17ECh. 20 - Prob. 18ECh. 20 - Prob. 19ECh. 20 - Prob. 20ECh. 20 - Prob. 21ECh. 20 - Drug use 2013 The 2013 World Drug Report...Ch. 20 - Prob. 23ECh. 20 - Saratoga house prices How does the price of a...Ch. 20 - Prob. 25ECh. 20 - Prob. 26ECh. 20 - Prob. 27ECh. 20 - Prob. 28ECh. 20 - Prob. 29ECh. 20 - More cholesterol Look again at Exercise 28s...Ch. 20 - Prob. 31ECh. 20 - Cholesterol, finis Based on the regression output...Ch. 20 - Prob. 33ECh. 20 - Prob. 34ECh. 20 - Prob. 35ECh. 20 - Prob. 36ECh. 20 - Prob. 37ECh. 20 - Prob. 38ECh. 20 - Prob. 39ECh. 20 - Fuel economy A consumer organization has reported...Ch. 20 - Climate change 2016 Data collected from around the...Ch. 20 - Prob. 42ECh. 20 - Prob. 43ECh. 20 - Fuel economy, part III Consider again the data in...Ch. 20 - Climate change again Consider once again the CO2...Ch. 20 - Cereals A healthy cereal should be low in both...Ch. 20 - Brain size Does your IQ depend on the size of your...Ch. 20 - Prob. 48ECh. 20 - Prob. 49ECh. 20 - Prob. 50ECh. 20 - Ozone and population The Environmental Protection...Ch. 20 - Prob. 52ECh. 20 - Prob. 53ECh. 20 - More sales and profits Consider again the...Ch. 20 - Prob. 55ECh. 20 - Crawling Researchers at the University of Denver...Ch. 20 - Midterms The data set below shows midterm and...Ch. 20 - Prob. 58ECh. 20 - Prob. 59ECh. 20 - All the efficiency money can buy 2011 A sample of...Ch. 20 - Education and mortality The following software...Ch. 20 - Property assessments The following software output...Ch. 20 - Prob. 63ECh. 20 - Prob. 64E
Knowledge Booster


Learn more about
Need a deep-dive on the concept behind this application? Look no further. Learn more about this topic, statistics and related others by exploring similar questions and additional content below.Similar questions
- Life Expectancy The following table shows the average life expectancy, in years, of a child born in the given year42 Life expectancy 2005 77.6 2007 78.1 2009 78.5 2011 78.7 2013 78.8 a. Find the equation of the regression line, and explain the meaning of its slope. b. Plot the data points and the regression line. c. Explain in practical terms the meaning of the slope of the regression line. d. Based on the trend of the regression line, what do you predict as the life expectancy of a child born in 2019? e. Based on the trend of the regression line, what do you predict as the life expectancy of a child born in 1580?2300arrow_forward3.4 SKILL BUILDING EXERCISES Getting Regression Lines Only Find the equation of the regression line for the following data set. x 1 2 3 y 3 3 4arrow_forward
Recommended textbooks for you
 Functions and Change: A Modeling Approach to Coll...AlgebraISBN:9781337111348Author:Bruce Crauder, Benny Evans, Alan NoellPublisher:Cengage Learning
 Big Ideas Math A Bridge To Success Algebra 1: Stu...AlgebraISBN:9781680331141Author:HOUGHTON MIFFLIN HARCOURTPublisher:Houghton Mifflin Harcourt
 Glencoe Algebra 1, Student Edition, 9780079039897...AlgebraISBN:9780079039897Author:CarterPublisher:McGraw Hill
Functions and Change: A Modeling Approach to Coll...
Algebra
ISBN:9781337111348
Author:Bruce Crauder, Benny Evans, Alan Noell
Publisher:Cengage Learning
Big Ideas Math A Bridge To Success Algebra 1: Stu...
Algebra
ISBN:9781680331141
Author:HOUGHTON MIFFLIN HARCOURT
Publisher:Houghton Mifflin Harcourt
Glencoe Algebra 1, Student Edition, 9780079039897...
Algebra
ISBN:9780079039897
Author:Carter
Publisher:McGraw Hill
Correlation Vs Regression: Difference Between them with definition & Comparison Chart; Author: Key Differences;https://www.youtube.com/watch?v=Ou2QGSJVd0U;License: Standard YouTube License, CC-BY
Correlation and Regression: Concepts with Illustrative examples; Author: LEARN & APPLY : Lean and Six Sigma;https://www.youtube.com/watch?v=xTpHD5WLuoA;License: Standard YouTube License, CC-BY