Concept explainers
Videos
Shoot to score, hat trick Returning to the results of Exercise 2, write a sentence to explain the meaning of the standard error of the slope of the regression line, SE(b1) = 0.0125, and the corresponding P-value.
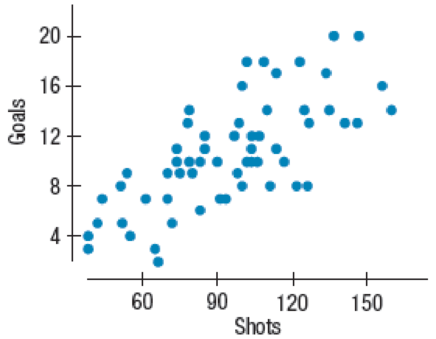
2. Shoot to score 2016 A college hockey coach collected data from the 2016–2017 National Hockey League season. He hopes to convince his players that the number of shots taken has an effect on the number of goals scored. The coach performed a preliminary analysis, using the scoring statistics from 65 offensive players who had played at least 44 games by the middle of the season. (If you use the data file, note that it includes defensive players as well. Use the variable Offense to select the players in this analysis.) He predicts Goals from number of Shots. Write the regression model and explain what the slope coefficient means in this context.
Response variable is: Goals
R squared = 49.9%
s = 2.983 with 65 – 2 = 63 degrees of freedom
| Variable | Coefficient | SE(Coeff) | t-ratio | P-value |
| Intercept | 1.13495 | 1.231 | 0.922 | 0.3602 |
| Shots | 0.099267 | 0.0125 | 7.93 | <0.0001 |
Want to see the full answer?
Check out a sample textbook solution
Chapter 20 Solutions
MyLab Statistics with Pearson eText -- Standalone Access Card -- for Intro Stats (5th Edition)


- XYZ Corporation Stock Prices The following table shows the average stock price, in dollars, of XYZ Corporation in the given month. Month Stock price January 2011 43.71 February 2011 44.22 March 2011 44.44 April 2011 45.17 May 2011 45.97 a. Find the equation of the regression line. Round the regression coefficients to three decimal places. b. Plot the data points and the regression line. c. Explain in practical terms the meaning of the slope of the regression line. d. Based on the trend of the regression line, what do you predict the stock price to be in January 2012? January 2013?arrow_forwardNoise and Intelligibility Audiologists study the intelligibility of spoken sentences under different noise levels. Intelligibility, the MRT score, is measured as the percent of a spoken sentence that the listener can decipher at a cesl4ain noise level in decibels (dB). The table shows the results of one such test. (a) Make a scatter plot of the data. (b) Find and graph the regression line. (c) Find the correlation coefficient. Is a linear model appropriate? (d) Use the linear model in put (b) to estimate the intelligibility of a sentence at a 94-dB noise level.arrow_forward3.4 SKILL BUILDING EXERCISES Getting Regression Lines For the following data: a Plot the data. b Find the equation of the regression line. c Add the graph of the regression line to the plot of the data points. x 1.3 2.5 3.3 4.2 5.1 y 2.6 2.6 2 1.8 1.5arrow_forward
 Functions and Change: A Modeling Approach to Coll...AlgebraISBN:9781337111348Author:Bruce Crauder, Benny Evans, Alan NoellPublisher:Cengage Learning
 Algebra and Trigonometry (MindTap Course List)AlgebraISBN:9781305071742Author:James Stewart, Lothar Redlin, Saleem WatsonPublisher:Cengage Learning
 College AlgebraAlgebraISBN:9781305115545Author:James Stewart, Lothar Redlin, Saleem WatsonPublisher:Cengage Learning
 Glencoe Algebra 1, Student Edition, 9780079039897...AlgebraISBN:9780079039897Author:CarterPublisher:McGraw Hill