
Concept explainers
Videos
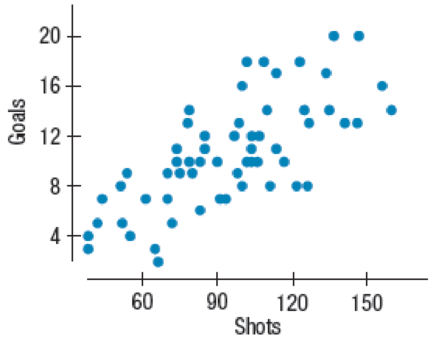
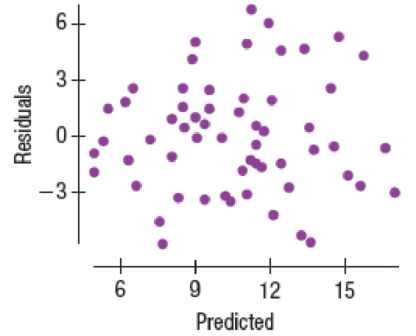
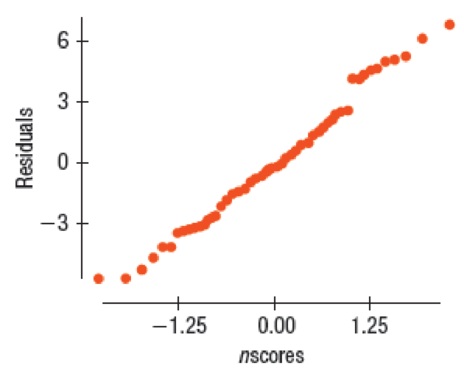
Shoot to score II Discuss the assumptions and conditions necessary for proceeding with the
2. Shoot to score 2016 A college hockey coach collected data from the 2016–2017 National Hockey League season. He hopes to convince his players that the number of shots taken has an effect on the number of goals scored. The coach performed a preliminary analysis, using the scoring statistics from 65 offensive players who had played at least 44 games by the middle of the season. (If you use the data file, note that it includes defensive players as well. Use the variable Offense to select the players in this analysis.) He predicts Goals from number of Shots. Write the regression model and explain what the slope coefficient means in this context.
Response variable is: Goals
R squared = 49.9%
s = 2.983 with 65 – 2 = 63 degrees of freedom
| Variable | Coefficient | SE(Coeff) | t-ratio | P-value |
| Intercept | 1.13495 | 1.231 | 0.922 | 0.3602 |
| Shots | 0.099267 | 0.0125 | 7.93 | <0.0001 |
Want to see the full answer?
Check out a sample textbook solution
Chapter 20 Solutions
Intro Stats, Books a la Carte Edition (5th Edition)


- Life Expectancy The following table shows the average life expectancy, in years, of a child born in the given year42 Life expectancy 2005 77.6 2007 78.1 2009 78.5 2011 78.7 2013 78.8 a. Find the equation of the regression line, and explain the meaning of its slope. b. Plot the data points and the regression line. c. Explain in practical terms the meaning of the slope of the regression line. d. Based on the trend of the regression line, what do you predict as the life expectancy of a child born in 2019? e. Based on the trend of the regression line, what do you predict as the life expectancy of a child born in 1580?2300arrow_forward3.4 SKILL BUILDING EXERCISES Getting Regression Lines Only Find the equation of the regression line for the following data set. x 1 2 3 y 3 3 4arrow_forwardOlympic Pole Vault The graph in Figure 7 indicates that in recent years the winning Olympic men’s pole vault height has fallen below the value predicted by the regression line in Example 2. This might have occurred because when the pole vault was a new event there was much room for improvement in vaulters’ performances, whereas now even the best training can produce only incremental advances. Let’s see whether concentrating on more recent results gives a better predictor of future records. (a) Use the data in Table 2 (page 176) to complete the table of winning pole vault heights shown in the margin. (Note that we are using x=0 to correspond to the year 1972, where this restricted data set begins.) (b) Find the regression line for the data in part ‚(a). (c) Plot the data and the regression line on the same axes. Does the regression line seem to provide a good model for the data? (d) What does the regression line predict as the winning pole vault height for the 2012 Olympics? Compare this predicted value to the actual 2012 winning height of 5.97 m, as described on page 177. Has this new regression line provided a better prediction than the line in Example 2?arrow_forward
 Algebra and Trigonometry (MindTap Course List)AlgebraISBN:9781305071742Author:James Stewart, Lothar Redlin, Saleem WatsonPublisher:Cengage Learning
 Functions and Change: A Modeling Approach to Coll...AlgebraISBN:9781337111348Author:Bruce Crauder, Benny Evans, Alan NoellPublisher:Cengage Learning
 College AlgebraAlgebraISBN:9781305115545Author:James Stewart, Lothar Redlin, Saleem WatsonPublisher:Cengage Learning
 Glencoe Algebra 1, Student Edition, 9780079039897...AlgebraISBN:9780079039897Author:CarterPublisher:McGraw Hill