
Intro Stats, Books a la Carte Edition (5th Edition)
5th Edition
ISBN: 9780134210285
Author: Richard D. De Veaux, Paul Velleman, David E. Bock
Publisher: PEARSON
expand_more
expand_more
format_list_bulleted
Concept explainers
Videos
Textbook Question
Chapter 20, Problem 51E
Ozone and population The Environmental Protection Agency is examining the relationship between the ozone level (in parts per million) and the population (in millions) of U.S. cities. Part of the
Dependent variable is Ozone
R-squared = 84.4%
s = 5.454 with 16 – 2 = 14 df
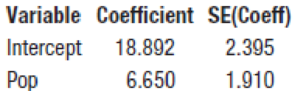
- a) We suspect that the ozone level is related to the population of a city. Is the relationship statistically significant? Assuming the conditions for inference are satisfied, test an appropriate hypothesis and state your conclusion in context.
- b) Do you think that the population of a city is a useful predictor of ozone level? Use the values of both R2 and s in your explanation.
Expert Solution & Answer
Want to see the full answer?
Check out a sample textbook solution
Chapter 20 Solutions
Intro Stats, Books a la Carte Edition (5th Edition)
Ch. 20.5 - Researchers in Food Science studied how big...Ch. 20.5 - Prob. 2JCCh. 20.5 - Prob. 3JCCh. 20.5 - Prob. 4JCCh. 20.5 - Prob. 5JCCh. 20.5 - Prob. 6JCCh. 20 - Graduate earnings Does attending college pay back...Ch. 20 - Shoot to score 2016 A college hockey coach...Ch. 20 - Prob. 3ECh. 20 - Shoot to score II Discuss the assumptions and...
Ch. 20 - Prob. 5ECh. 20 - Shoot to score, another one Using the regression...Ch. 20 - Prob. 7ECh. 20 - Shoot to score, hat trick Returning to the results...Ch. 20 - Prob. 9ECh. 20 - Shoot to score, number five What can the hockey...Ch. 20 - Prob. 11ECh. 20 - Prob. 12ECh. 20 - Prob. 13ECh. 20 - Prob. 14ECh. 20 - Prob. 15ECh. 20 - Shoot to score, double overtime Continuing from...Ch. 20 - Prob. 17ECh. 20 - Prob. 18ECh. 20 - Prob. 19ECh. 20 - Prob. 20ECh. 20 - Prob. 21ECh. 20 - Drug use 2013 The 2013 World Drug Report...Ch. 20 - Prob. 23ECh. 20 - Saratoga house prices How does the price of a...Ch. 20 - Prob. 25ECh. 20 - Prob. 26ECh. 20 - Prob. 27ECh. 20 - Prob. 28ECh. 20 - Prob. 29ECh. 20 - More cholesterol Look again at Exercise 28s...Ch. 20 - Prob. 31ECh. 20 - Cholesterol, finis Based on the regression output...Ch. 20 - Prob. 33ECh. 20 - Prob. 34ECh. 20 - Prob. 35ECh. 20 - Prob. 36ECh. 20 - Prob. 37ECh. 20 - Prob. 38ECh. 20 - Prob. 39ECh. 20 - Fuel economy A consumer organization has reported...Ch. 20 - Climate change 2016 Data collected from around the...Ch. 20 - Prob. 42ECh. 20 - Prob. 43ECh. 20 - Fuel economy, part III Consider again the data in...Ch. 20 - Climate change again Consider once again the CO2...Ch. 20 - Cereals A healthy cereal should be low in both...Ch. 20 - Brain size Does your IQ depend on the size of your...Ch. 20 - Prob. 48ECh. 20 - Prob. 49ECh. 20 - Prob. 50ECh. 20 - Ozone and population The Environmental Protection...Ch. 20 - Prob. 52ECh. 20 - Prob. 53ECh. 20 - More sales and profits Consider again the...Ch. 20 - Prob. 55ECh. 20 - Crawling Researchers at the University of Denver...Ch. 20 - Midterms The data set below shows midterm and...Ch. 20 - Prob. 58ECh. 20 - Prob. 59ECh. 20 - All the efficiency money can buy 2011 A sample of...Ch. 20 - Education and mortality The following software...Ch. 20 - Property assessments The following software output...Ch. 20 - Prob. 63ECh. 20 - Prob. 64E
Knowledge Booster


Learn more about
Need a deep-dive on the concept behind this application? Look no further. Learn more about this topic, statistics and related others by exploring similar questions and additional content below.Similar questions
- XYZ Corporation Stock Prices The following table shows the average stock price, in dollars, of XYZ Corporation in the given month. Month Stock price January 2011 43.71 February 2011 44.22 March 2011 44.44 April 2011 45.17 May 2011 45.97 a. Find the equation of the regression line. Round the regression coefficients to three decimal places. b. Plot the data points and the regression line. c. Explain in practical terms the meaning of the slope of the regression line. d. Based on the trend of the regression line, what do you predict the stock price to be in January 2012? January 2013?arrow_forwardRemainder Round all answers to two decimal places unless otherwise indicated. Gross Domestic Product U.S. gross domestic product, in trillions of dollars, is given in the table below. Date Gross domestic product 2010 15.0 2011 15.5 2012 16.2 2013 16.7 a.Find the equation of the regression line, and explain the meaning of its slope. Round regression line parameters to two decimal places. b.Plot the data points and the regression line. c.When would you predict that a gross domestic product of 17.3 trillion dollars would be reached? The actual gross domestic product in 2014 was 17.3 trillion dollars. What does that say about your prediction?arrow_forwardA regression was run to determine whether there is arelationship between the diameter of a tree (x, in inches) and the tree’s age (y, in years). Theresults of the regression are given below. Use this topredict the age of a tree with diameter 10 inches. y=ax+ba=6.301b=1.044r=0.970arrow_forward
arrow_back_ios
arrow_forward_ios
Recommended textbooks for you
 Glencoe Algebra 1, Student Edition, 9780079039897...AlgebraISBN:9780079039897Author:CarterPublisher:McGraw Hill
 Functions and Change: A Modeling Approach to Coll...AlgebraISBN:9781337111348Author:Bruce Crauder, Benny Evans, Alan NoellPublisher:Cengage Learning
 College AlgebraAlgebraISBN:9781305115545Author:James Stewart, Lothar Redlin, Saleem WatsonPublisher:Cengage Learning
 Algebra & Trigonometry with Analytic GeometryAlgebraISBN:9781133382119Author:SwokowskiPublisher:Cengage
 Algebra and Trigonometry (MindTap Course List)AlgebraISBN:9781305071742Author:James Stewart, Lothar Redlin, Saleem WatsonPublisher:Cengage Learning
Glencoe Algebra 1, Student Edition, 9780079039897...
Algebra
ISBN:9780079039897
Author:Carter
Publisher:McGraw Hill
Functions and Change: A Modeling Approach to Coll...
Algebra
ISBN:9781337111348
Author:Bruce Crauder, Benny Evans, Alan Noell
Publisher:Cengage Learning
College Algebra
Algebra
ISBN:9781305115545
Author:James Stewart, Lothar Redlin, Saleem Watson
Publisher:Cengage Learning
Algebra & Trigonometry with Analytic Geometry
Algebra
ISBN:9781133382119
Author:Swokowski
Publisher:Cengage
Algebra and Trigonometry (MindTap Course List)
Algebra
ISBN:9781305071742
Author:James Stewart, Lothar Redlin, Saleem Watson
Publisher:Cengage Learning
Correlation Vs Regression: Difference Between them with definition & Comparison Chart; Author: Key Differences;https://www.youtube.com/watch?v=Ou2QGSJVd0U;License: Standard YouTube License, CC-BY
Correlation and Regression: Concepts with Illustrative examples; Author: LEARN & APPLY : Lean and Six Sigma;https://www.youtube.com/watch?v=xTpHD5WLuoA;License: Standard YouTube License, CC-BY