
Concept explainers
Videos
The bar graph shows your chances of surviving to various ages once you reach 60.
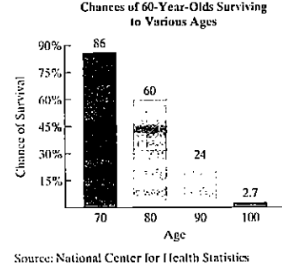
The functions
model the chance, as a percent, that a 60-year old will survive to age x. Use this information to solve Exercises 101-102.
a. Kind and interpret f (90).
b. Kind and interpret g (90).
c. Which function serves as a better model for the chance of surviving to age 90?
Want to see the full answer?
Check out a sample textbook solution
Chapter 2 Solutions
MyLab Math with Pearson eText -- Standalone Access Card -- for Algebra and Trigonometry (6th Edition)


- U.S. Census data shows that the median price of new home in the United States in November 2014 was $280,900. This was $10,700 more than 14 times the price in November 1964. What was the median price of a new home in November 1964?arrow_forwardHow will you spend your average life expectancy of 78 years?The bar graph shows the average number of years you will devote to each of your most time-consuming activities.According to the American Bureau of Labor Statistics, you will devote 37 years to sleeping and watching TV. The numberof years sleeping will exceed the number of years watching TV by 19. Over your lifetime, how many years will you spend on each of these activities?arrow_forwardThe bar graph shows your chances of surviving to various ages once you reach 60. The functions f(x) = -2.9x + 286 and g(x) = 0.01x2 - 4.9x + 370model the chance, as a percent, that a 60-year-old will survive to age x. Solve; a. Find and interpret f(70). b. Find and interpret g(70). c. Which function serves as a better model for the chance of surviving to age 70?arrow_forward
- Poaching refuces a population of animals by 4% per year. When the population of tis animal fals below 60 it will become extinct. If the current population is 1700 when will it face extinction?arrow_forwardAn antique table increases in value according to the function v(x)=550(1.05)x dollars, where x is the number of years after1980 . a. How much was the table worth in 1980 ? b. If the pattern indicated by the function remains valid, what was the value of the table in 1995 ? c. Use a table or a graph to estimate the year when this table will reach double its 1980 value.arrow_forwardThe bar graph shows the average price of new cars in the United Statesand the average age of cars on U.S. roads for two selected years.In 2014, the average price of a new car was $37,600. For the period shown, new-car prices increased by approximately $1250 per year. If this trend continues, how many years after 2014 will the price of a new car average $46,350? In which yearwill this occur?arrow_forward
- Determine whether the statement given below makes sense or does not make sense, and explain your reasoning : "For each $1 increase in the price of a $300 plane ticket, an airline will lose 60 passengers, so if the ticket price is increased to $x, the decrease in passengers is modeled by 60(300 – x)."arrow_forwardThe cost of technology-related products tends to decrease over time, unlike the cost of food, which tends to increase, according to the consumer price index. a) A graphing calculator sells for $184.99 in 2001. How much would it sell for in 2007 if the rate of decrease is 5.5%? b) The cost of a 4-L bag of milk is $3.69 in 2001. How much would you pay for the milk in 4 years if the expected average increase in the consumer price index for food is 3.2%?arrow_forwardHousing prices in a particular county have increased by 29.5% over the price of houses five years ago. (a)If $260,000 was the average price of a house five years ago, what is the average price (in $) of a house today? (b)Economists predict that next year housing prices will drop by 5% in this area. Based on your answer from part (a), what will the average price (in $) of a house be next year?arrow_forward
- Several states have argued that the 65-mph speed limit has no justification and have refused to enforce it. The federal Department of Transportation (DOT) believes that the 65-mph limit saves lives. To illustrate its contention, the department regressed the number of traffic fatalities (Y) last year in a state on the state’s population (X1), the number of days of snow cover (X2), and the average speed of all cars (X3). The results are shown below. With all else being equal, how many lives would be saved in a state if the average speed were reduced from 75 to 65 mph? Does reducing the average speed of cars have a statistically significant impact? Explain.arrow_forwardmonique collects data rom a random sample of seventh gradesers in her school and finds that 10 out of 25 seventh graders participate in after school activeities write and solve a proportion to estimate the number of seventh graders n who participate in after school activeities of 190 seventh graders attened monique's schoolarrow_forwardA university is trying to determine what price to charge for tickets to football games. At a price of 28$ per ticket, attendance averages 40,000 people per game. Every decrease of $4 adds 10,000 people to the average number. Every person at the game spends an average of $6 on concessions. What price per ticket should be charged in order to maximize revenue? How many people will attend at that price? What is the price per ticket ? What is the average attendance ?arrow_forward
 College Algebra (MindTap Course List)AlgebraISBN:9781305652231Author:R. David Gustafson, Jeff HughesPublisher:Cengage Learning
 Elementary AlgebraAlgebraISBN:9780998625713Author:Lynn Marecek, MaryAnne Anthony-SmithPublisher:OpenStax - Rice University
 Algebra: Structure And Method, Book 1AlgebraISBN:9780395977224Author:Richard G. Brown, Mary P. Dolciani, Robert H. Sorgenfrey, William L. ColePublisher:McDougal Littell
 Glencoe Algebra 1, Student Edition, 9780079039897...AlgebraISBN:9780079039897Author:CarterPublisher:McGraw Hill
 Big Ideas Math A Bridge To Success Algebra 1: Stu...AlgebraISBN:9781680331141Author:HOUGHTON MIFFLIN HARCOURTPublisher:Houghton Mifflin Harcourt